Download
1 / 9
90 likes | 233 Views
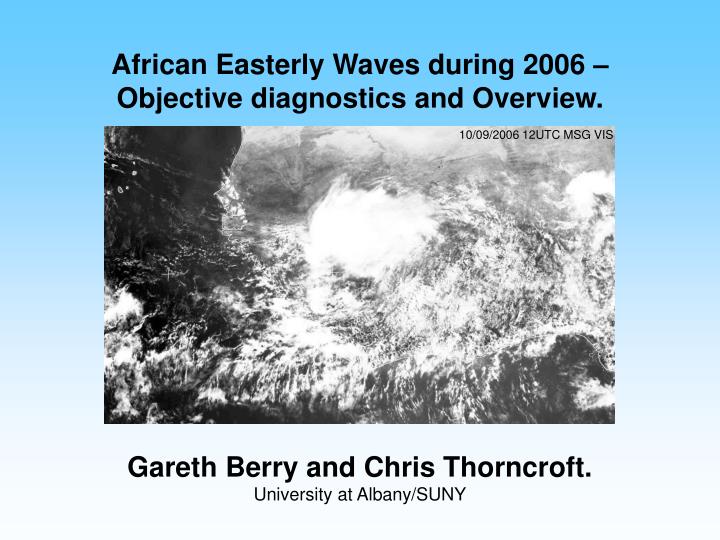
African Easterly Waves during 2006 – Objective diagnostics and Overview. 10/09/2006 12UTC MSG VIS. Gareth Berry and Chris Thorncroft. University at Albany/SUNY. Rationale for objective diagnostics. General:

E N D
African Easterly Waves during 2006 – Objective diagnostics and Overview. 10/09/2006 12UTC MSG VIS Gareth Berry and Chris Thorncroft. University at Albany/SUNY
Rationale for objective diagnostics. • General: • Scale interactions – Need to objectively and unambiguously define the synoptic scale AEW in order to examine the relationship with the mesoscale convective systems (MCSs). • Forecasting/Synoptic analysis – Requires an intuitive, succinct, reliable representation of AEWs in order to aid discussion. • AMMA Specific: • Context for other AMMA studies – Were the AEWs that occurred during the observing period weak/strong/average? • Case study selection. – Identify suitable periods or individual events during the AMMA campaign. Jul 1 – Jul 10 2004 Jul 1 – Jul 10 2004 Jul 1 – Jul 10 2004
(Quick) Summary of objective diagnostics. Trough lines are defined at 700hPa where the advection of non-divergent curvature vorticity by the non-divergent wind is equal to zero. Masks are added to isolate cyclonic features in easterly flow. To be considered AEWs troughs must be long lived (>24hrs) and cross the objective AEJ axis (defined as location where 700hPa non-divergent shear vorticity is equal to zero). ◄AEW trough (solid black), AEJ axis (dashed black) diagnostics on 315K Potential Vorticity (PV) (Coloured) and METEOSAT IR for 12th Sept 2004. Much more detail available online: http://www.atmos.albany.edu/student/gareth/plots.html Jul 1 – Jul 10 2004 Jul 1 – Jul 10 2004 Jul 1 – Jul 10 2004
July, August, September 2006 AEW activity overview. Hovmöller diagram of 700hPa curvature vorticity (averaged 5-15N) from GFS analyses: 27 objectively defined AEWs during July, August and September 2006. (compare with 27 in JAS 2005, 31 in JAS 2004) 1 2 3 4 5 6 7 8 9 10 11 12 13 14 16 15 17 18 19 20 21 22 23 24 27 25 26
July, August, September 2006 AEW activity overview. Hovmöller diagram of 700hPa curvature vorticity (averaged 5-15N) from GFS analyses: 27 objectively defined AEWs during July, August and September 2006. (compare with 27 in JAS 2005, 31 in JAS 2004) 1 2 3 4 5 6 7 8 Relatively weak AEW activity east of Niamey during July. 9 10 11 12 13 14 16 15 17 18 19 20 21 22 23 24 27 25 26
July, August, September 2006 AEW activity overview. Hovmöller diagram of 700hPa curvature vorticity (averaged 5-15N) from GFS analyses: 27 objectively defined AEWs during July, August and September 2006. (compare with 27 in JAS 2005, 31 in JAS 2004) 1 2 3 4 5 6 7 8 Relatively weak AEW activity east of Niamey during July. 9 10 11 12 13 14 Relatively weak AEW activity west of Niamey during August. 16 15 17 18 19 20 21 22 23 24 27 25 26
July, August, September 2006 AEW activity overview. Hovmöller diagram of 700hPa curvature vorticity (averaged 5-15N) from GFS analyses: 27 objectively defined AEWs during July, August and September 2006. (compare with 27 in JAS 2005, 31 in JAS 2004) 1 2 3 4 5 6 7 8 Relatively weak AEW activity east of Niamey during July. 9 10 11 12 13 14 Relatively weak AEW activity west of Niamey duringAugust. 16 15 17 18 19 20 Relatively intense AEW activity across continent during most of September. 21 22 23 24 27 25 26
July, August, September 2006 AEW activity overview. Hovmöller diagram of 700hPa curvature vorticity (averaged 5-15N) from GFS analyses: B For each objectively defined AEW, the peak non-divergent curvature vorticity maximum (x10-5 s-1) is recorded in boxes A and B (each 5 degrees wide). Mean values for each season: A 1 2 3 4 5 6 7 8 9 10 11 12 13 14 16 15 17 18 19 20 21 22 23 24 27 25 26
Outlook. Scale interactions – What is the nature of the relationship between deep convection and AEW dynamics? Aim to make use of AMMA Radar observations (Earle Williams, MIT), enhanced sounding network and numerical models (NCEP/ECMWF and WRF) to examine the potential vorticity structure and tendencies of MCSs and AEWs TRMM/IR merged precipitation estimate (3B42 product, Coloured) with 700hPa non-divergent curvature vorticity (contoured every 2.5x10⁻⁶ s-1 greater than 2.5x10⁻⁶ s-1), both average 5-15N for 1st – 10th Sep 2005.