Download
1 / 35
350 likes | 498 Views
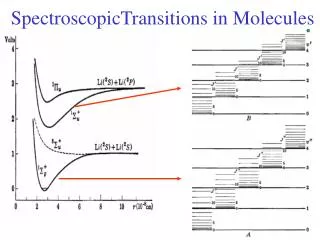
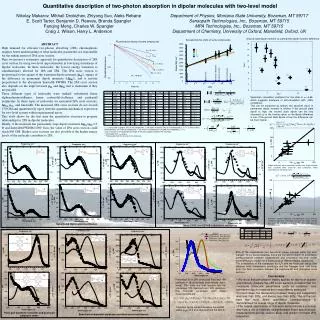
Molecules traced in absorption. SAAS-FEE Lecture 7 Françoise COMBES. Advantages of the absorption. Absorption measures are very useful, in particular in the Galaxy, where both emission and absorption can be detected along the same line of sight Obtention of the physical conditions, T, N

E N D
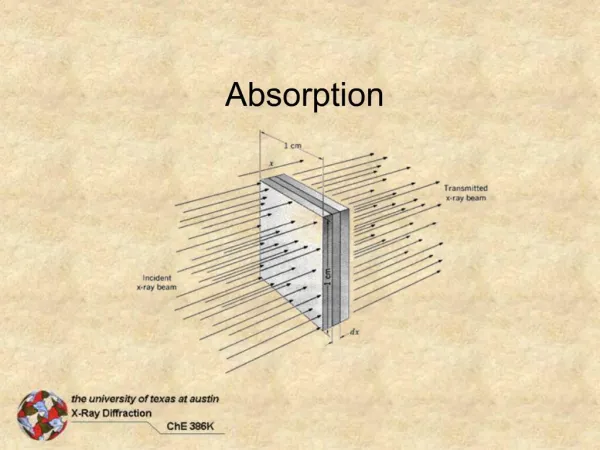
Molecules traced in absorption SAAS-FEE Lecture 7 Françoise COMBES
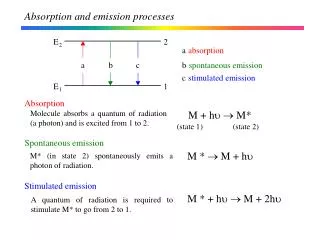
Advantages of the absorption Absorption measures are very useful, in particular in the Galaxy, where both emission and absorption can be detected along the same line of sight Obtention of the physical conditions, T, N Spatial resolution with absorption (QSO size) However, there is a bias towards cold gas, for absorption In the Rayleigh-Jeans domain TA* = (Tex -Tbg) (1 - e-τ) Emission when Tex > Tbg
For the atomic line HI at 21cm for instance large influence of stimulated emission ("negative absorption") since the ΔT between the two levels F=1, 0 is only ~0.7 K ƒτdv ~ N/T In emission, N(cm-2) ~ƒTexτdv ~ƒTadv ==> independent of temperature While the optical depth of the absorption signal is in 1/T Experiences ON-source, and OFF-source Ta(ON), Ta(OFF) gives Tex or Tsp In the millimeter, CO rotation for instance at 2.6mm there exists the whole rotational ladder
Emission: depends on temperature, since Nu/Ntot = gu/Z e-Eu/kT Nu(cm-2) ~ƒTexτdv ~ƒTadv if τ << 1, and Ntot ~T Nu eEu/kT Absorption: ƒτdv ~ N/T(1- e-hν/kT) strongly weighted by the temperature Tex Since collisional excitation requires 4 104 cm-3 for CO, and 1.6 107 cm-3 for HCN In hot (kinetic temperature) and diffuse media, the excitation temperature will be very low, --> 2.76 K Absorption is weighted by the diffuse medium
Molecular absorption in the Galaxy More difficult to observe, since continuum sources are weaker (S ~ν-α) and smaller. Requires interferometry to resolve and distinguish from emission ==> explains the work is recent (the last decade) Marscher et al (1991) in front of BlLac Small filling factor in surface, even of the diffuse CO medium 9 3C sources/100 have CO emission (Liszt & Wilson 93) Among them, 60% show absorption Extinction of only Av~1 mag, but already very abundant chemistry (Lucas & Liszt, 1994)!
Liszt & Lucas 2001 Survey of 30 l.o.s. (Lucas & Liszt 96) HCO+ 30% as often as HI abs more frequent than CO
13CO, CN, HCO+, HCN, HNC, C2H, N2H+ (Lucas & Liszt 94-98) with line ratios quite variable from one l.o.s. to the other Big surprise, the strength of HCO+ absorption, in these diffuse media -- higher critical density, so HCO+ is "cold" -- chemistry to be revised in diffuse medium! Some lines are very optically thick (13CO is detected) others τ << 1 (hyperfine lines of HCN, in the ratio 5:3:1 expected) ΔV = 0.5 - 1km/s Abundances of CO versus HCO+ variable by 20! Bistability? Chaos ? (Le Bourlot et al 1993)
Absorptions sometimes variable over a year time-scale presence of clumpy material, of sizes 10-100 AU in front on the continuum source Also spatial fluctuations in the chemistry (Liszt & Lucas 2000) CO can form rapidly from HCO+ in diffuse clouds H2 can form at relatively low density whenever H2 is there HCO+/H2 = 2 10-9 and then CO forms by recombination of HCO+ (CO turn on) HCO+ is linearly correlated with OH X(HCO+) = 0.03-0.05 X(OH) even at low column density CO forms later (when C+ is recombined) Diffuse clouds have chemical abundances of dark clouds!
Liszt & Lucas, 96, 2000 OH and HCO+ tightly correlated at low column density, contrary to CO
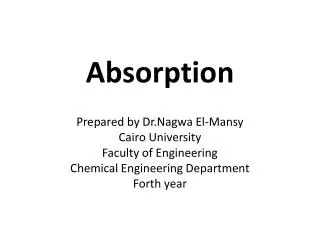
Computed temperatures for gas spheres of N(H) = 5 1020cm-2, according to density CO and C+ column density for the same models (Liszt & Lucas 2000) H2 formation can occur at low density, while HCO+ is present, but not CO the C is still largely under C+
N(CO) increases abruptly when N(HCO+) = 1-2 1012 cm-2 slope of the power-law: 1.5 CO and H2 column density from the UV (Federman et al 95) Slope of the power-law is 2.02
ΔV(HCO+) = 15% higher ΔV(CO) Surprisingly large 13CO abundance Fractionation, much more efficient than selective photodissociation 12CO + 13C+ --> 13CO +12C+
Extragalactic molecular absorptions • When the line of sight of a radio-loud QSO crosses a galaxy, and • also a molecular cloud (quite rare) ==> absorption in the mm, cm • Prolongation to the high column density of the Lyα absorbers • in particular DLA ==> N(NH) power law • Lyα forest N ~ 1013 cm-2 (intergalactic filaments) • HI-21cm 1020 cm-2 (Damped Lyα systems) Outer parts of galaxies • CO, HCO+.. 1020-24 cm-2(the center of galaxies) • The number (N) decreases as a power law
Comparison with emission The absorption technique is much more sensitive than emission At high redshift for instance, the detection limit is 1010Mo While the absorption limit does not depend on redshift As soon as the QSO source behind is detected, the absorption limit is in optical depth τ The source is quasi ponctual at mm, up to 1012K Galactic versus extragalactic: for MW absorption studies, interferometer is required, since absorption is generally buried among strong emission of local molecular clouds The nearest absorption is Centaurus A, where both are of the same order
Centaurus A In CO line emission and absorption are detected Many other lines are detected in absorption only (Wiklind & Combes 1997) Eckart et al 90
No temporal variation (Wiklind & Combes 1997) ==> Constraints can be put on the source size, of > 500 AU Low density gas, low excitation and low Tkin optically thin lines Wide absorption in HCO+, could correpond to a nuclear disk
Higher redshift absorptions First high-z absorption towards the BLLac object PKS1413+135 (Wiklind & Combes 1994), after many unfruitful searches towards DLAs Since then, 4-5 systems are known, but remain rare Half of them are gravitationally lensed objects PKS1830-211 and B0218+357 The absorbing molecular clouds are in the lensing galaxy ==> a way to find molecules in normal galaxies at high z Redshifts range up to z~1 (the QSO at z~2), difficult to find higher redshifts QSO, that are strong enough in the mm (steep spectrum)
In absorption, detected masses can be only 1 Mo Large variety of line widths, optical depths, sometimes several lines are detected along the same l.o.s.
Selection of candidates: -- Strong mm source (0.15 Jy at 3mm) only 100-200 -- already an absorption detected in HI-21cm, or DLAs, or MgII or CaII -- absence of previous absorption, but known gravitational lens (VLBI) (Webster et al 95, Stickel & Kuhr 93) -- same as above, without any known redshift: the case of PKS1830-211 The redshift was discovered in the mm sweeping of the band (14 GHz = 14 tuning, and already 2 lines) --sources where the redshift searched is that of the QSO Mostly negative results!
PKS1413+135 z=0.247 Very narrow absorption < 1km/s (2 comp) BlLac, very variable, also in radio optically thin, N(H2) > 1022 cm-2, Av > 30 mag McHardy et al 94
Temporal variability, and small-scale structure The opacity ratio between the two components has varied by 2.3 over 2 years Variations due to the l.o.s. change due to the variability of the continuum source Superluminic source Core unresolved 2.3mas or 7pc, might be 10μas = 0.03pc 250km/s = 50AU/yr insufficient (100yrs) > 25 000 km/s required ==> must come from the core
Compatible with either a multi-component model with similar filling factors or with dense clumps embedded in a diffuse medium The diffuse component accounts for most of the absorption, while the clumps comprise most of the mass Because of the very narrow velocity width the cloud along the l.o.s. must be quite small 1pc according to size/line-width relation n(H2) ~104 cm-3 variability seen in the CO, not in HCO+ (more optically thick) HCO+ more from the diffuse component
B3 1504+377 z=0.672 7 different molecular lines Large separation 330km/s nuclear ring + spiral arm absorption hosted by the source HNC/HCN => Tkin = Tex HCO+ enhanced by 10-100 diffuse + clumps
B0218+357 z=0.685 Gravitational lens (two images A and B) The largest column density 1024cm-2 Two images separation 335mas (1.8kpc) All three CO isotopes are optically thick This was an excellent oppotunity to search for O2 without atmospheric absorption Lines at 368 and 424 GHz O2/CO < 2 10-3 (Combes et al 97) most of O in OI??
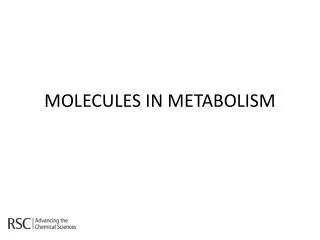
LiH tentative detection HD and LiH cooling lines LiH 21K above ground H2O detection at 557 GHz, very large τ =40 000 H2O ubiquitous and cold T=10-15 K H2O/H2=10-5 444GHz line of LiH, optically thin very narrow, LiH/H2 ~3 10-12
Two images A and B, separated by HST (335mas) VLBA measurements (Patnaik et al 93, 95) The two images separated in A1, A2, B1, B2 (lens potential non spherical)
PKS1830-211 z=0.88582 Frye et al 97 2 images, + Einstein ring But 2 absorbing systems, one at z=0.19 seen in HI
Two components, covering each one image of the source as confirmed by PdB (Wiklind & Combes 1998) Slight temporal variability
Monitoring, measure of H0 The single dish (without resolving the 2 images) can follow the intensity of the two, since they are absorbing at two V Monitoring during 3 years (1h per week) ==> delay of 24+5 days, H0 = 69 +12 km/s/Mpc
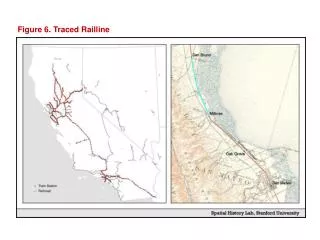
Evolution of chemical conditions? Various line ratios have been obtained in the many absorptions at all z There does not seem to be variations versus z=0 (open circles) but large scatter, even at z=0 (Lucas & Liszt 94, 06)
Measure of Tmb (z) Low excitation (diffuse gas) Tex ~Tmb The case for PKS1830-211 Several transitions give the same result (slightly lower, due to a microlens) From UV H2 lines Srianand et al 2000
Variation of constants Kaluza-Klein theories, Strings and M-theory, predict variations of α = e2/hc fine structure constant Heterodyne resolution R=106 Method of Alkali doublet of many multiplet Webb et al (2001) Appears to have a variation, at high z only Murphy et al (2001) Δ α / α =(-0.72 +0.18 )10-5
H2 bands in absorption, at high z UV lines at high z Foltz et al (1988) N(H2) = 1018cm-2, Ge Bechtold (97) z=1.97 N(H2) = 7 1019cm-2, T=70K n =300cm-3 total N(H) = 1020cm-2, f(H2) = 0.22 dust and strong CI Srianand et al (2000), Petitjean et al (2000) LMC
PKS1232+082 z=2.3377 Petitjean et al 00
Conclusion Absorption is a precious tool to observe cold gas diffuse, with low excitation Small masses are detected Chemistry can be investigated Gas in galaxies that are not ultra-luminous Bias in the optical/UV towards low column density