Download
1 / 12
120 likes | 204 Views
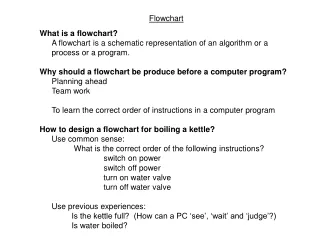
Flowchart Diagram. Risanuri Hidayat. What. A Flow Chart is a sequential diagram that shows the steps involved in an operation or task and the decisions made along the way.

E N D
Flowchart Diagram Risanuri Hidayat
What • A Flow Chart is a sequential diagram that shows the steps involved in an operation or task and the decisions made along the way. • A flowchart illustrates the steps in a process. By visualizing the process, a flowchart can quickly help identify bottlenecks or inefficiencies where the process can be streamlined or improved. • With flow chart diagram, you can graphically document the steps used to complete a task.
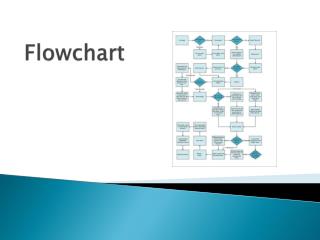
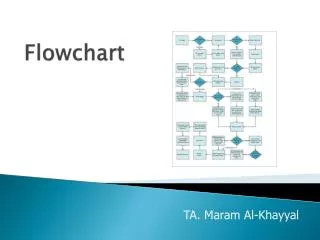
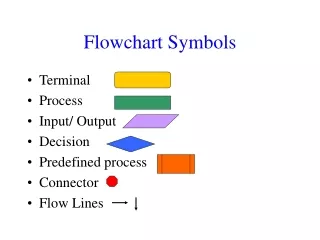
Flowcharting Shapes • Flowcharts use special shapes to represent different types of actions or steps in a process. • Lines and arrows show the sequence of the steps, and the relationships among them.
Shapes • The terminator symbol marks the starting or ending point of the system. It usually contains the word "Start" or "End." Start/End
Shapes • A box can represent a single step ("add two cups of flour"), or and entire sub-process ("make bread") within a larger process. Action/Process
Shapes • A printed document or report. Document
Shapes • A decision or branching point. Lines representing different decisions emerge from different points of the diamond. true ?
Shapes • Represents material or information entering or leaving the system, such as customer order (input) or a product (output). Input/Output
Shapes • Indicates that the flow continues on another page, where a matching symbol (containing the same letter) has been placed. connector
Shapes • Lines indicate the sequence of steps and the direction of flow.
start Input n yes n<1 no F=1.2…(n) n=1 F=1 no yes A Tampilkan F A end Example • Hitung nilai factorial dari x • F(n)= n! = n(n-1)(n-2)…1 • Jika n=1, F(n)=1 • Jika n<1, ditolak
Example • Program ?