Download
1 / 8
80 likes | 293 Views
La Distribución Normal. Francisco Álvarez González - 2007. Karl Friedrich Gauss (1777 – 1855). TIPIFICACIÓN. Tabla N(0,1). Áreas a la izquierda. Pr (z < 1,25) = 0’89435. 1. Tipificar. EL PROCESO. nº = p x N p % = p x 100. 2. 3. Tablas. p = Pr (z < valor).

E N D
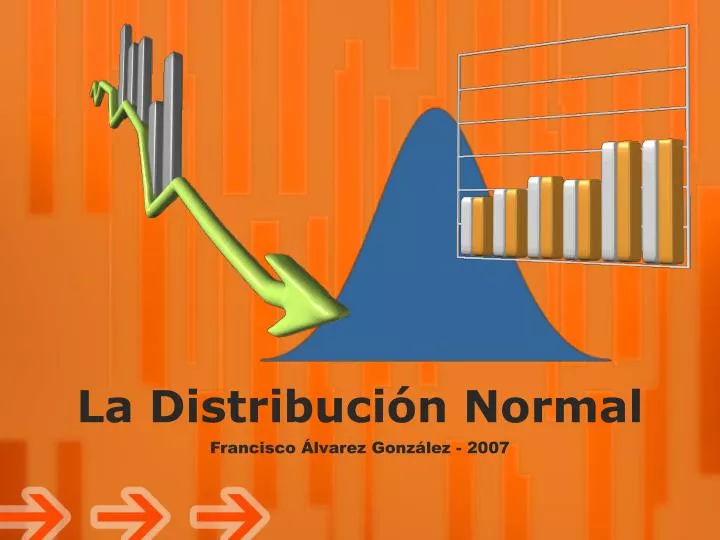
La Distribución Normal Francisco Álvarez González - 2007
Karl Friedrich Gauss (1777 – 1855)
Tabla N(0,1) Áreas a la izquierda
1 Tipificar EL PROCESO nº = p x N p % = p x 100 2 3 Tablas p = Pr (z < valor)
Las calificaciones de los 500 aspirantes presentados a un examen para contratación • laboral, se distribuye normalmente con media 6'5 y desviación típica 2. • Calcule la probabilidad de que un aspirante obtenga menos de 8 puntos. • ¿Cuántos aspirantes obtuvieron calificaciones comprendidas entre 5 y 7'5 puntos?. N(6’5 , 2) Tablas: p = 0'77337 EJEMPLO p = 0‘69146 - 0’22663 = 0’46483 nº = 0’46483 x 500 = 232’415 232 aspirantes p = 0‘69146 p = 0‘22663
La Distribución Normal Francisco Álvarez González - 2007