Download

1 / 8
90 likes | 254 Views
Global Economics. Who Is Involved ?. 1870. 1913. USA. 23.3. 35.8. Germany. 13.2. 15.7. U.K. 31.8. 14.0. France. 10.3. 6.4. Russia. 3.7. 5.5. Italy. 2.4. 2.7. Canada. 1.0. 2.3. Belgium. 2.9. 2.1. Sweden. 0.4. 1.0. Japan. 1.2. India. 10.0. 1.1.

E N D
1870 1913 USA 23.3 35.8 Germany 13.2 15.7 U.K. 31.8 14.0 France 10.3 6.4 Russia 3.7 5.5 Italy 2.4 2.7 Canada 1.0 2.3 Belgium 2.9 2.1 Sweden 0.4 1.0 Japan 1.2 India 10.0 1.1 Percentage Distribution of the World's Manufacturing/ Production, 1870 and 1913 (percentage of world total) ---- Other 1.0 12.2
UK France Germany Russia Italy 1781-90 3.8 10.9 ----- ----- ------ 1801-14 7.1 12.3 ----- ----- ------ 1825-34 18.8 21.5 ----- ----- ----- 1845-54 27.5 33.7 11.7 ----- ----- 1865-74 49.2 49.8 24.2 13.5 42.9 1885-94 70.5 68.2 45.3 38.7 54.6 1905-13 100.0 100.0 100.0 100.0 100.0 % of world industrial production in 1913 6.4 17.7 5.5 2.7 The Rate of Industrial Growth in Five Selected Countries Indices of Industrial Production (Base Figures - 1905-13 = 100) 14.0
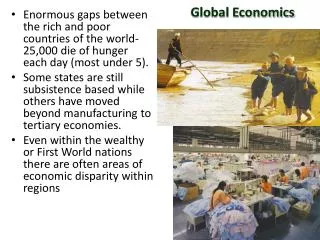
Money For You! . Lant Pritchett estimates that between 1870 and 1985 the ratio of incomes in the richest and poorest countries increased six fold, the standard deviation of (natural log) per capita incomes increased by between 60 and 100 percent, and the average income gap between the richest and poorest countries grew almost nine fold (from $1500 to over $12,000).
The Customer Has The Power! A global economy exists to serve the people. A global economy opens many opportunities for people all across the world.