Download
1 / 19
190 likes | 250 Views
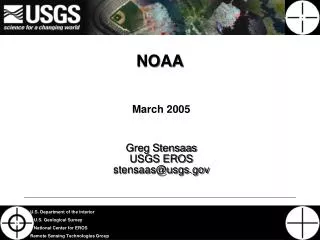
Graphic courtesy NOAA / PMEL / Center for Tsunami Research. Pacific Northwest Waters Gateway to Our Future Communication through the NANOOS Visualization System Jonathan Allan NANOOS User Products Chair . Why have a NANOOS visualization system?.

E N D
Graphic courtesy NOAA / PMEL / Center for Tsunami Research Pacific Northwest Waters Gateway to Our Future Communication through the NANOOS Visualization System Jonathan Allan NANOOS User Products Chair
Why have a NANOOS visualization system? • Disparate suite of web sites available to the public (serving a wide range of data). • Regional needs: seamless delivery of coastal, estuarine and ocean data to stakeholders within the NANOOS domain (+external partners, other RCOOS, and national/international programs). • NANOOS currently provides access to 47 different types of variables, and in total ~160 ‘assets’. Effective delivery of these data and product feeds can lead to: • greater situational awareness (local and regional scales); • improved access to and understanding of environmental variables/conditions; and, • enable development and access to short- and long-term time-series. • Overall goal: to aid our understanding of climate variability, safety, operations, and lead to improved resource management and regional productivity.
The Challenge - Many Stakeholders • State (e.g. ODFW, WADOE, DSL,…) and Federal agencies (NOAA, NWS, FEMA, US Coast Guard,...), • Cities and Counties • Ocean engineering (instruments, wave energy, telecommunication), • NGO’s, • Ports, • Bar pilots, • Fishers (recreational and commercial), • Shellfish growers, • Recreational boaters, • Tribes, • Geotechnical consultants, • Universities/researchers, • Schools (k-12), • Public-at-large, • and many others…
Methods of Communication Needs to be seamless, accurate, of sufficient temporal and spatial resolution, and meets user needs; Includes: portals, specific data/product page views, mobile applications, direct links, etc. Key Requirements: • Interoperability with national-scale applications • Reliable, efficient ingest of data • Access to models, applications, tools and information products • A rich, yet simple (Google-maps) interface based around the following core functions: • current conditions; • forecasts; and, • access to historical data.
Overlays (Satellite, Models, & other geospatial data) Shelf moorings & gliders Shorelines & Bathymetry
TsunamiNW-Evac (iPhone/Android)