Download
1 / 25
250 likes | 459 Views
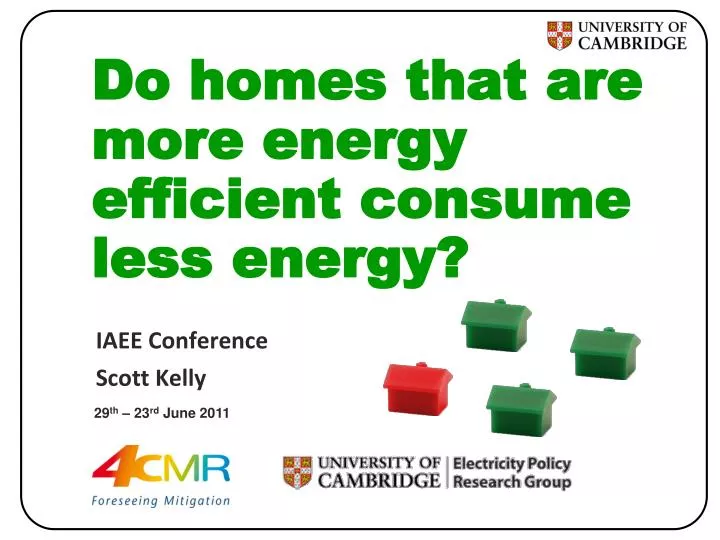
Do homes that are more energy efficient consume less energy?. IAEE Conference Scott Kelly. 29 th – 23 rd June 2011. Do homes that are more energy efficient consume less energy?. Outline. Motivation and context Data-sources and variables Structural Equation Modelling (SEM)

E N D
Do homes that are more energy efficient consume less energy? IAEE Conference Scott Kelly 29th – 23rd June 2011
Do homes that are more energy efficient consume less energy?
Outline • Motivation and context • Data-sources and variables • Structural Equation Modelling (SEM) • Application of SEM • Results • Policy implications
Context GHG emissions by source in the UK 2008 GHG emissions by end-use in the UK 2008 (MtCO2eq) Total = 627 MtCO2eq Source: DECC (http://decc.gov.uk/en/content/cms/statistics/climate_change/data/data.aspx) 73%of UK GHG attributable to household consumption demand. (Druckman & Jackson 2009) Bottom Up VS Top Down
DATA • Data from 1996 EHCS and FES • English House Condition Survey (EHCS) - 12,131 cases • Fuel and Energy Survey (FES) - 2,531 cases • EHCS contains information on physical properties. • FES contains energy consumption characteristics + metered energy data!!! • Economic status of occupants, demographics etc. • Stratified sample -> weighted dataset • Explanatory variables identified from dataset • Number of HHLD occupants (cont.) • HHLD income (cont.) • Floor area (cont.) • SAP (Standard Assessment Procedure) (cont.) • Temperature difference (External - Internal) (cont.) • Energy pattern (0-5 ) (categorical) • Dwelling energy expenditure (and consumption) (cont.) • Age of head of HHLD (cat.) • Heating Degree Days (cont.) • Urban dummy • Owner dummy • Economic status dummy
SAP • Standard Assessment Procedure • SAP is the governments standard assessment procedure for rating the energy performance of buildings. • The adopted methodology in L1A and L1B (existing) • Measured on scale from 0 - 100 • Multiple evolutions of procedure - 1996, 1998, 2001, 2005, 2008 • Factors used to calculate SAP • Materials used for construction • Thermal insulation of building fabric • Ventilation characteristics of the dwelling and equipment • Efficiency and control of the heating system • Solar gain through windows and openings • The type of fuel used to provide heating • Any renewable energy technologies installed.
Do homes that are more energy efficient consume less energy?
Presumed non-recursive (reciprocal) causal effect (A causes B but B also causes A) Presumed direct causal effect • Manifest variable (indicator variable) Unobserved or latent variables ε Covariance / Correlation between pair of exogenous variables Symbols used in SEM Measured error in observed variable
STANDARD REGRESSION MODEL X1 Y D X2 X3 Typical SEM layout
Data preparation • Outliers -> Type I and and Type II errors. • Univariate outliers • Multivariate outliers - Cook’s distance & centred leverage • HHLD Income, Floor Area, Energy Expenditure, truncated to 5 std. from mean. • Missing Data • Problematic in SEM if not handled correctly (Lee, 2005) • Less than 5% missingness. • MNAR, MAR & MCAR. (Rubin, 1976) • Listwise deletion, pairwise deletion, mean substitution, regression based imputation, pattern matching & expectation maximisation. • Tested effect of missingness in data -> EM Method.
Results Table 4: standardised direct effects
e2 e3 0.19** 0.27** 0.27** Household Income Energy Pattern Temperature Difference Floor Area Number of Occupants SAP 0.31** 0.38** 0.13** -0.22** 0.23** e4 e5 0.15** 0.12** Model Results 0.23 -0.05 0.19** 0.31** 0.13** -0.22** 0.23** 0.38** 0.29 0.33** Annual Energy Expenditure 0.11 0.15** e1 0.12** 0.09** 0.05 0.09** 0.02
SAP Rating Low propensity to consume energy Measured energy consumption Actual energy consumption Explaining SAP High propensity to consume energy High energy Energy pattern Number of occupants HHLD income Floor Area Low energy
Bootstrapping Table 7: Bootstrapping results
Model fit statistics • Model fit statistics in SEM are still widely debated • In SEM, the null-hypothesis (H0) is that the model is correct. The alternative (Ha) is that it is not. • Therefore (and p-value) measures probability that model fits perfectly to the population. • If P<0.05 we can’t reject null-hypothesis that the model is correct and therefore have evidence the model may explain reality. Table 8: Model fit statistics
Results Table 9 : Total real effects on energy expenditure (1996) Average income = £15,317 Average SAP rating = 44.4 Average occupancy = 2.51 Average annual energy expenditure = £642(1996) £1167(2009)
Policy implications • Homes with a propensity to consume more energy are shown to have relatively higher SAP rates. • The scope for further savings from these homes may be limited. • Homes with relatively high SAP ratings are subject to the law of diminishing returns. • Homes with a propensity to consume less energy, have lower SAP rates and therefore have greater potential to benefit from energy efficiency measures. • These homes already consume relatively less energy. • These homes are also more likely to be affected by the rebound effect. • This suggests an Energy Efficiency Barrier that must first be overcome. • This calls for more comprehensive and larger energy efficiency measures. • Different strategies for different energy consumers. Dual policy approach.
Do homes that are more energy efficient consume less energy?
Thanks Scott Kelly sjk64@cam.ac.uk
References • Vernon, D T., 2007. Editorial Board/Publication Information. Personality and Individual Differences, 42(5), CO2. Available at: http://www.sciencedirect.com/science/article/B6V9F-4N0YTYJ-1/2/633cc4f1810315c0c44b9aff88933071 [Accessed August 16, 2010]. • Aigner, D.J., Sorooshian, C. & Kerwin, P., 1984. Conditional Demand Analysis for Estimating Residential End-Use Load Profiles. The Energy Journal. Available at: http://econpapers.repec.org/article/aenjournl/1984v05-03-a06.htm [Accessed July 12, 2010]. • Aydinalp, M., Ugursal, V. & Fung, A., 2003. Modelling of residential energy consumption at the national level. International Journal of Energy Research, 27(4), 441-453. Available at: http://dx.doi.org/10.1002/er.887 [Accessed December 31, 2009]. • Aydinalp-Koksal, M. & Ugursal, V.I., 2008. Comparison of neural network, conditional demand analysis, and engineering approaches for modeling end-use energy consumption in the residential sector. Applied Energy, 85(4), 271-296. Available at: http://www.sciencedirect.com/science/article/B6V1T-4PPWMKT-1/2/00e584c85a9ea29aa33a1ffc7de0fd33 [Accessed May 13, 2010]. • Azadeh, A., Saberi, M. & Seraj, O., 2010. An integrated fuzzy regression algorithm for energy consumption estimation with non-stationary data: A case study of Iran. Energy, 35(6), 2351-2366. Available at: http://www.sciencedirect.com/science/article/B6V2S-4YRXKC2-1/2/6941e7f45306604323da8868deb7d7df [Accessed May 13, 2010]. • Baker, K.J. & Rylatt, R.M., 2008. Improving the prediction of UK domestic energy-demand using annual consumption-data. Applied Energy, 85(6), 475-482. Available at: http://www.sciencedirect.com/science/article/B6V1T-4R7D01S-1/2/84bb8c06ef691adfe81f5690b9d314a5 [Accessed July 14, 2010]. • Baker, P., Blundell, R. & Micklewright, J., 1989. Modelling Household Energy Expenditures Using Micro-Data. The Economic Journal, 99(397), 720-738. Available at: http://www.jstor.org/stable/2233767 [Accessed July 14, 2010]. • BERR, 2008. Renewable Energy Strategy, Available at: http://www.berr.gov.uk/energy/sources/renewables/strategy/page43356.html. • Blunch, N.J., 2008. Introduction to Structural Equation Modelling Using SPSS and AMOS, London: SAGE. • Böhringer, C. & Rutherford, T.F., 2009. Integrated assessment of energy policies: Decomposing top-down and bottom-up. Journal of Economic Dynamics and Control, 33(9), 1648-1661. Available at: http://www.sciencedirect.com/science/article/B6V85-4VWHVX8-2/2/6bb86cc14dee1381c0b012812016e89d [Accessed July 12, 2010]. • BRE, 2005. The Governments Standard Assessment Procedure for Energy Rating of Dwellings, • Centre for alternative technologies, 2007. Zero Carbon Britain, Available at: http://www.cat.org.uk/news/news_release.tmpl?command=search&db=news.db&eqSKUdatarq=37990&home=0 . • Communities and Local Government, 2006. Building a Greener Future: Towards Zero Carbon Development - Consultation - Planning, building and the environment - Communities and Local Government, Available at: http://www.communities.gov.uk/archived/publications/planningandbuilding/buildinggreener [Accessed April 1, 2009]. • Communities and Local Government, 2010. English Housing Survey (EHS) - Housing - Communities and Local Government. Available at: http://www.communities.gov.uk/housing/housingresearch/housingsurveys/englishhousingsurvey/ [Accessed August 23, 2010]. • DECC, 2009. Heat and Energy Saving Strategy Consultation, Available at: http://hes.decc.gov.uk/ [Accessed March 26, 2009]. • DETR, 1996. English House Condition Survey: User Guide • Dorofeev, S., 2006. Statistics for Real-Life Sample Surveys: Non-Simple-Random Samples and Weighted Data, Cambridge: Cambridge University Press. • ECI, 2005. 40% house, Environmental Change Institute. Available at: http://www.eci.ox.ac.uk/research/energy/downloads/40house/40house.pdf [Accessed May 17, 2009]. • Elliott, A., 2007. Statistical analysis quick reference guidebook : with SPSS examples, Thousand Oaks Calif.: Sage Publications.
References • Energy Efficiency Partnership, 2008. An assesment of the size of the UK household energy efficiency market, Element Energy Ltd. Available at: http://www.eeph.org.uk/uploads/documents/partnership/Assessment%20of%20the%20UK%20household%20energy%20efficiency%20market_171108.pdf [Accessed May 6, 2009]. • Fiebig, D.G., Bartels, R. & Aigner, D.J., 1991. A random coefficient approach to the estimation of residential end-use load profiles. Journal of Econometrics, 50(3), 297-327. Available at: http://www.sciencedirect.com/science/article/B6VC0-45828KT-15/2/468b7905ac68f93a2c0bb72622daa437 [Accessed July 12, 2010]. • Great Britain., 2007. Building a greener future : policy statement., London: Dept. for Communities and Local Government. • Hitchcock, G., 1993. An integrated framework for energy use and behaviour in the domestic sector. Energy and Buildings, 20(2), 151-157. Available at: http://www.sciencedirect.com/science/article/B6V2V-47XF6WC-49/2/bdd2bf07c9bd94b31c8af1b85a31d453 [Accessed May 13, 2010]. • Hoogwijk, M., van Vuuren, D.P. & Scrieciu, S., 2008. Secotoral emission mitigation potentials: Comparing bottom up and top down approaches, Available at: http://www.env.go.jp/press/file_view.php?serial=12478&hou_id=10316 [Accessed May 15, 2009]. • Jebaraj, S. & Iniyan, S., 2006. A review of energy models. Renewable and Sustainable Energy Reviews, 10(4), 281-311. Available at: http://www.sciencedirect.com/science/article/B6VMY-4DS7NYR-1/2/9eaf57b390ee97d59e4b83255470dd8b [Accessed May 13, 2010]. • Johnston, D., 2003. A physically Based Energy and Carbon dioxide emission model of the UK Housing Stock. Available at: http://www.leedsmet.ac.uk/as/cebe/assets/djthesis.pdf [Accessed May 15, 2009]. • Kaplan, D., 2009. Structural Equation Modeling: Foundations and Extensions 2nd ed., London: SAGE. • Kavgic, M. et al., 2010. A review of bottom-up building stock models for energy consumption in the residential sector. Building and Environment, 45(7), 1683-1697. Available at: http://www.sciencedirect.com/science/article/B6V23-4Y889R7-1/2/58548662baa14e28ab75d32ad0b8ee22 [Accessed July 9, 2010]. • Keith, T., 2006. Multiple Regression and Beyond, Boston, Mass: Pearson Education. • Kline, R.B., 2005. Principles and Practice of Structural Equation Modeling 2nd ed., New York, NY: Guilford Press. • Larsen, B.M. & Nesbakken, R., 2003. How to quantify household electricity end-use consumption. The Energy Journal. Available at: http://econpapers.repec.org/scripts/a/abstract.plex?h=repec:ssb:dispap:346 [Accessed July 12, 2010]. • Lee, S., 2007. Structural Equation Modeling: A Bayesian Approach, Chichester: Wiley. • Levine, M. & Urge-Vorsatz, D., 2008. Chapter 6 - Resdiential and Commercial Buildings. In IPCC AR4 WGIII. Available at: http://www.ipcc.ch/pdf/assessment-report/ar4/wg3/ar4-wg3-chapter6.pdf [Accessed April 20, 2009]. • McFarland, J.R., Reilly, J.M. & Herzog, H.J., 2004. Representing energy technologies in top-down economic models using bottom-up information. Energy Economics, 26(4), 685-707. Available at: http://www.sciencedirect.com/science/article/B6V7G-4CPM1NF-1/2/78915c04f7b0f9800c127ebd28e7ff5e [Accessed May 17, 2009]. • McKinsey, 2009. Pathways to a Low-Carbon Economy, Available at: file:///D:/Scotts%20Stuff/PhD%20Material/Litterature/Reports/MCkinsey/PathwayToLowCarbonEconomy_FullReportA.pdf [Accessed May 5, 2009] • Mckinsey, 2008. Sustainable Urban Infrastructure Study - London Edition a view to 2025, London. Available at: http://w1.siemens.com/entry/cc/features/sustainablecities/all/pdf/SustainableUrbanInfrastructure-StudyLondon.pdf.
References • Parti, M. & Parti, C., 1980. The Total and Appliance-Specific Conditional Demand for Electricity in the Household Sector. The Bell Journal of Economics, 11(1), 309-321. Available at: http://www.jstor.org/stable/3003415. • Perron, D. & Lafrance, G., 1994. Evolution of Residential Electricity Demand by End-Use in Quebec 1979-1989: A Conditional Demand Analysis. Energy Studies Review, 6(2). Available at: http://digitalcommons.mcmaster.ca/esr/vol6/iss2/4 [Accessed July 12, 2010]. • Rubin, D.B., 1976. Inference and Missing Data. Biometrika, 63(3), 581-592. Available at: http://www.jstor.org/stable/2335739 [Accessed July 21, 2010]. • Rylatt, R., Gadsden, S. & Lomas, K., 2003. Methods of predicting urban domestic energy demand with reduced datasets: a review and a new GIS-based approach. Building Services Engineering Research & Technology, 24(2), 93-102. Available at: http://search.ebscohost.com/login.aspx?direct=true&db=bth&AN=9925511&site=ehost-live&scope=site [Accessed March 30, 2010]. • Schumacker, R.E. & Marcoulides, G. eds., 1996. Full information estimation in the presence of incomplete data. In Advanced structural equation modeling: issues and techniques. L. Erlbaum Associates. • Shorrock, L., 2003. A detailed analysis of the historical role of energy efficiency in reducing carbon emissions from the UK housing stock. ECEE. Available at: http://www.bre.co.uk/filelibrary/rpts/eng_fact_file/Shorrock.pdf [Accessed May 21, 2009]. • Strachan, N. & Kannan, R., 2008. Hybrid modelling of long-term carbon reduction scenarios for the UK. Energy Economics, 30(6), 2947-2963. Available at: http://www.sciencedirect.com/science/article/B6V7G-4SDPX7W-1/2/b2ca447237df5e8683b6a726320f820f [Accessed July 14, 2009]. • Summerfield, A.J., Lowe, R.J. & Oreszczyn, T., 2010. Two models for benchmarking UK - domestic delivered energy. Building Research & Information, 38(1), 12. Available at: http://www.informaworld.com/10.1080/09613210903399025 [Accessed June 9, 2010]. • Swan, L.G. & Ugursal, V.I., 2008. Modeling of end-use energy consumption in the residential sector: A review of modeling techniques. Renewable and Sustainable Energy Reviews, In Press, Corrected Proof. Available at: http://www.sciencedirect.com/science/article/B6VMY-4VBC3X3-2/2/338f45a5b335f8a8ee44523322033fd1 [Accessed April 7, 2009]. • Tabachnick, B.G., 2007. Using Multivariate Statistics 5th ed., Boston [Mass.]: Pearson/A&B. • Tso, G.K. & Yau, K.K., 2007. Predicting electricity energy consumption: A comparison of regression analysis, decision tree and neural networks. Energy, 32(9), 1761-1768. Available at: http://www.sciencedirect.com/science/article/B6V2S-4MR1P3S-1/2/541d5b6c12ec4c9bb28cf2da82fc53b9 [Accessed June 21, 2010]. • Tuladhar, S.D. et al., 2009. A top-down bottom-up modeling approach to climate change policy analysis. Energy Economics, 31(Supplement 2), S223-S234. Available at: http://www.sciencedirect.com/science/article/B6V7G-4WVT0KJ-1/2/e678cbcc8418613e6e47a0ab5604af5e [Accessed July 12, 2010]. • UK Government, 2008. Climate Change Act 2008, Available at: http://www.opsi.gov.uk/acts/acts2008/ukpga_20080027_en_1 [Accessed May 12, 2009]. • World Business Council for Sustainabe Development, 2009. Energy Efficiency in Buildings - Transforming the market, Available at: http://62.50.73.69/transformingthemarket.pdf [Accessed April 27, 2009]. • WWF, 2007. WWF Building Stock Report, Available at: http://assets.wwf.org.uk/downloads/how_low_report.pdf [Accessed April 14, 2009].
Key Facts • Average HHLD energy demand is 22 MWh / year • Every 1 degree increase in heating season temp. leads to a reduction of 1MWh / year • Energy price elasticity is measured at -0.2 this means a 50% increase in energy prices leads to 10% reduction in energy demand. (A. J. Summefield et al, 2010)
Non-recursivity • Stationarity assumption • Requires the causal structure of the model not to change substantially over time. • e.g. large houses will consume more energy. • Equilibrium assumption • Any changes underlying the feedback relationship have already manifested and come to equilibrium. • e.g. high income HHLD’s effect on energy.