Download
1 / 89
890 likes | 1.04k Views
Trading to Improve Water Quality. Webcast December 14, 2005 Lynda Hall U.S. Environmental Protection Agency and Sonja Biorn-Hansen Oregon Department of Environmental Quality. 1. What We’ll Cover. What is trading? How does trading work?

E N D
Trading to Improve Water Quality Webcast December 14, 2005 Lynda Hall U.S. Environmental Protection Agency and Sonja Biorn-Hansen Oregon Department of Environmental Quality 1
What We’ll Cover • What is trading? • How does trading work? • Setting trading boundaries, defining credits, identifying buyers and sellers • Project examples • Where does trading work? For what pollutants? • Benefits and challenges of trading 2
What We’ll Cover • Key functions for all trading programs • CWA compliance, public information, connecting buyers/sellers • Trading to reduce thermal load in the Tualatin River, Oregon • Where is trading occurring now? • What’s next for trading • Where to get more information 3
Cap and trading Emissions trading Pollutant trading Effluent trading Offsets Mitigation What is “Trading”? 4
Lead in gasoline phasedown 1980’s Acid rain – 1990’s Wetlands mitigation Endangered species habitat Streambank restoration Greenhouse gas reduction Water quality trading ‘Trading’ is a general approach useful for many environmental problems 5
What is Water Quality Trading (WQT)? • Watershed management approach suited to particular water quality challenges • Based in economic market principles • Sources facing higher pollutant control costs may purchase environmentally equivalent pollutant reductions from another source at lower cost • Voluntary, but integrated and consistent with Clean Water Act regulations • An approach to meeting CWA goals, not an alternative to them 6
How Trading Works • A ‘cap’ or limit is placed on the total amount of pollutant that can be released from all sources • Timeframe is established to meet cap • Sources receive an allocation, i.e.,authorization to release a given amount of pollutant • Sources can meet their allocation by: • Making all necessary reductions on-site OR • Buying additional allocations - credits - from other sources that have reduced pollutants below their own allocation 7
The WQT ‘cap’ is often a TMDL • Or other consensus water quality goal • TMDLs are the most common WQT caps • Establish pollutant ‘budget’ sufficient to achieve water quality standards • PS are assigned individual wasteload allocations • Implemented via water quality-based effluent limits in NPDES permits • NPS are assigned load allocations by category • Not enforceable under CWA • Trading can provide incentives for NPS pollutant reductions Introduction 8
How Trading Works, cont’d • The exchange of credits to meet the water quality cap is ‘trading’ • BUYERS have high pollutant control costs • SUPPLIERS have lower costs • WQT takes different forms • Point/point source trades among NPDES facilities • Watershed scale; implemented via group permit • Point/nonpoint source trades • So far limited to offsets for a single NPDES facility • Point/nonpoint source trading on a watershed scale 9
Watershed Scale PS/NPS Trading • Several programs under development • Passaic River, NJ • Cape Fear River, NC • Kalamazoo River, MI • Miami River, OH • others 11
Questions? 12
Example: Seasonal Hypoxia in Long Island Sound • Excessive nutrient loadings contribute to hypoxic zone in Long Island Sound each summer • To eliminate hypoxia, Connecticut TMDL calls for 64% nitrogen reduction among 79 wastewater treatment plants by 2014 • Challenging goal, potential price tag $1 billion 13
2000 2014 15% 15% Flow Load Each facility was allocated a percentage of the total statewide TMDL loading equal to their percentage contribution to the statewide current discharge flow rate. 15
Nitrogen Cap and Trade:Long Island Sound • CT established a Nitrogen Exchange allowing WWTPs to • reduce nitrogen or • buy nitrogen reductions from the Exchange or • over-control nitrogen and sell reductions • 79 WWTPs covered by one NPDES permit • Permit has aggregate cap that declines every two years to meet 2014 goal 16
Water Quality Equivalence • WQT changes location of pollutant controls within a watershed • Water quality equivalence considers that the impact of pollutant control at source A may differ from source B • Ratios, based on pollutant fate and transport models, account for different WQ impacts Suitability Analysis 17
0.17 0.14 0.32 0.19 0.46 0.18 0.93 1.00 0.11 18
LIS TMDL IMPLEMENTATION 50,000 40,000 /day) 30,000 lbs Nitrogen ( 20,000 10,000 0 2000 2001 2004 2007 2008 2010 2011 2014 2002 2003 2005 2006 2009 2012 2013 Year 19
Questions? 20
Example:South Nation River, Ontario • Trading to reduce total phosphorus in NPS-dominated watershed 21
South Nation Water Quality Challenge • Phosphorus (P) degradation • Annual mean five times greater than water quality objective of .3 mg/l • 18 wastewater treatment plants with several new or expanding facilities • High treatment costs 22
Cap and Trade to Reduce P • Province capped loads at 1998 levels • New or expanded dischargers must achieve no net increase of P in watershed by: • treating their discharge to zero kg P OR • buying P credits to offset loads at 4:1 ratio • SNC Authority is the broker for all P trades 23
How credits are generated • Calculations developed for a set of BMPs • Manure storage • Milk-house washwater treatment • Barnyard runoff control • Limiting livestock access • Buffer strips • Ratio of 4 to 1 applied • Credits generated when project installed 24
Trading Process Summary 1. SNC Negotiates TPM Agreement with Discharger 2. Discharger pays SNC $/kg - SNC flows money into Clean Water Program 3. Clean Water Committee allocates $ to eligible projects - Farmer Field Reps do all site inspections, reporting to Committee 4. Landowners complete approved projects • 5. SNC verifies project is complete • Invoices and photos of completed project • Field Reps randomly inspect 10% of completed projects 25
Trading Process, cont’d 6. SNC calculates P reduction from completed projects 7. SNC combines P reductions from all eligible projects and allocates credits to the dischargers 8. SNC reports annually to dischargers on $ contributed and P credits allocated 9. Annual Clean Water Program Report completed and circulated to watershed stakeholders 26
Monitoring • 13 stations sampled monthly for surface water quality (April – Nov.) • Historical data>40 years at some stations, provides baseline information to track P trends over time • Monitoring provides data on WQ trends, not on individual BMPs 27
Avoiding “hot spots” • Trading programs sometimes raise concerns about “hot spots” or locally high pollutant loads • Circumstances that potentially create hotspots can be identified in advance • Large credit buyers or increased discharge upstream of an impoundment or slow-moving reach • Large credit buyers or increased discharges into a highly impaired water segment • Any purchase of credits directly upstream of drinking water reservoir • Trades that become large by crossing numerous equivalency zones 28
Avoiding “hot spots” through program design • Trading program can and should be designed to avoid hot spots. Some approaches for doing so include: • For group permits, include individual permit limits for parameters affecting local water quality, e.g., ammonia nitrogen • Limit the number of credits used within an area • Limit the direction of trades, e.g., upstream versus downstream, or weight trades to favor a direction • Apply minimum reductions (before trading) on sources with high potential for creating local impacts 29
Questions? 30
State or Regional Trading Policies One-Time Offset Agreements Ongoing Offset/Trading Programs Other Projects and Recent Proposals Source: Morgan and Wolverton (2005) and Breetz and Fisher-Vanden (2004) Water Quality Trading Activity 31
Where Do We Stand With Water Quality Trading? (Scale of trading) • So far most trades are single facility offsets • Three watershed scale PS trading programs in place, all to protect nutrient-impaired estuaries • Connecticut Long Island Sound • Neuse River, NC • Tar-Pamlico, NC • Watershed scale programs under development • Passaic River NJ • Cape Fear River NC • Kalamazoo River, MI • Bear River, CO/WY • Lake Tahoe • Lower Boise River, ID • Miami River, OH 32
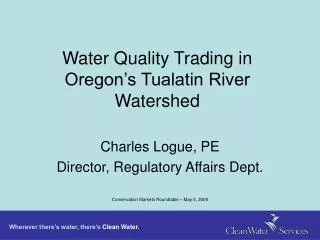
Water Quality Program Water Quality Trading in Oregon Experiences to Date, What’s Next 33
Water Quality Program Perceptions of Trading • Proponents: Trading is a way to bring free market efficiencies to reduce compliance costs • Opponents: Trading is a way for polluters to get off the hook • Alternate view: Trading can be a better way to protect the resource 34
Water Quality Program Tualatin River Temperature Profile(Observed and Predicted for 7/27/99) 36
Water Quality Program Trading Case Study: Clean Water Services • The following are allowed: • 1. Temperature trading involving a combination of the following: • Riparian shading • Flow augmentation • 2. “Bubble” permit limits for BOD and ammonia • Limits allow interplant and intraplant trading of BOD and ammonia 37
Water Quality Program CWS Trade: Advantages • Avoids the environmental downsides to refrigeration (high need for electricity). • Riparian shading via native plants + flow aug. = greater environmental benefit. • Much cheaper for the source. 38
Water Quality Program CWS Trade: A Side Benefit We are getting good data on: • What it takes to get riparian areas planted on agricultural land. • What it takes/will take to keep it planted. 39
Water Quality Program How much will CWS have to do? Flow augmentation: • CWS is able to purchase about 30 cfs throughout the summer • Impact established via modeling: about ½ excess heat load is offset Riparian restoration: • About 35 miles of stream to be planted 40
Water Quality Program How much… (cont’d)? Riparian restoration: • Impact quantified by measuring the amount of solar radiation that is blocked by shade-producing vegetation 41
Water Quality Program “Good” Riparian Area 42
Water Quality Program “Bad” Riparian Area 43
Water Quality Program How do they get so “bad”? Streams are messy and unpredictable, they meander and flood. So, people try to control them. --Methods: removal of streamside vegetation, channel straightening, installation of dikes, levees and riprap. And… impervious area happens. As watersheds become increasingly built-up, peak flows increase. 44
Water Quality Program What happens when people try to control streams? The Law of Unintended Consequences kicks in. Some unintended consequences: --Increased erosion rates. --Streamside vegetation becomes dominated by nonnative invasives. Or riprap. Or concrete. 45
Water Quality Program Back to how much is enough… The Basic Equation: Length of Stream Required = Excess Heat Load (per day) (Reduced Solar Load x Stream Width) 46
Water Quality Program Daily Solar Loading Rates 47
Water Quality Program Problems… • Trees will take a long time to grow • “You are giving CWS credit for something the farmers should already be doing” 49
Water Quality Program Compensating for Growth Rate of Trees 50