Download
1 / 15
150 likes | 310 Views
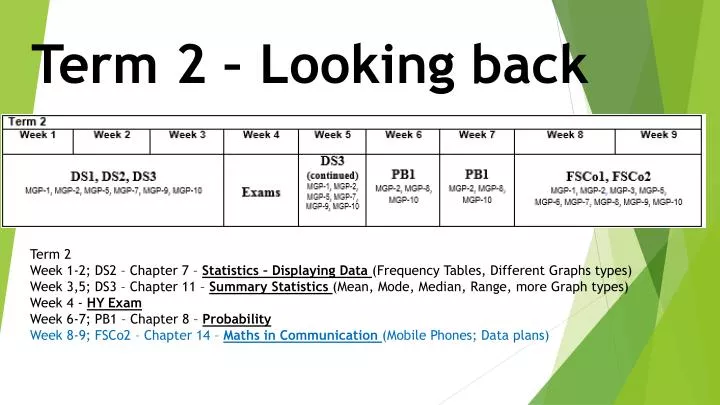
Term 2 – Looking back. Term 2 Week 1-2; DS2 – Chapter 7 – Statistics – Displaying Data (Frequency Tables, Different Graphs types) Week 3,5; DS3 – Chapter 11 – Summary Statistics (Mean, Mode, Median, Range, more Graph types) Week 4 - HY Exam Week 6-7; PB1 – Chapter 8 – Probability

E N D
Term 2 – Looking back Term 2 Week 1-2; DS2 – Chapter 7 – Statistics – Displaying Data (Frequency Tables, Different Graphs types) Week 3,5; DS3 – Chapter 11 – Summary Statistics (Mean, Mode, Median, Range, more Graph types) Week 4 - HY Exam Week 6-7; PB1 – Chapter 8 – Probability Week 8-9; FSCo2 – Chapter 14 – Maths in Communication (Mobile Phones; Data plans)
Write the heading! Write the sub heading!
You need to turn to p473 for parts (c) to (e); we will do these on the next slide, so skip to (f)
A fairly simple Exercise 14A (p473) Q1,2,3 Looking at the increments, calls are charged by 30 sec increments
The question you need to ask is, “How many 30 second intervals are included in each call?”
To do: Exercise 14B (p476-478) Q2,4,6,8,10,12,14,16,18*
To do: Exercise 14C(p480-481) Q2,3,5,7,9 As you have done Step Graphs & Radar Charts before, then do Exercise 14D Q1,3,5,11,12* * get a radar chart template from teacher or do in Excel
Write the heading! • Scientific (or standard) notation is a convenient way of writing large and small numbers. • Numbers in scientific notation have two parts: • A number between 1 and 10 • A power of 10 • To Write Numbers In Scientific Notation • Move the decimal point to make a number between 1 and 10 • Count the number of places from the new decimal point to the old one (to the right means a positive power, to the left means a negative power). • eg. 14 000 = 14 104, 432 000 = 432 105, 00000342 = 342 10-5 • Examples • 1. Write the following numbers in scientific notation. • (a) 70 000 = (b) 8430 = • 2. Write the basic numeral for: • (a) 3 104= (b) 365 106 = • 3. Write in scientific notation. • (a) 00004 = (b) 00004321 = • 4. Write as a basic numeral: • (a) 45 10-4 = (b) 528 10-2 = Summarise the notes and Examples. = 7 104 = 8.43 104 Do Exercise 14F (p492-493) Q2,4,5,7,9,10 = 3 650 000 = 30 000 = 4 10-4 = 4.321 10-4 = 0.052 8 = 0.000 45