1 / 53

Forecast uncertainty and forecast intervals

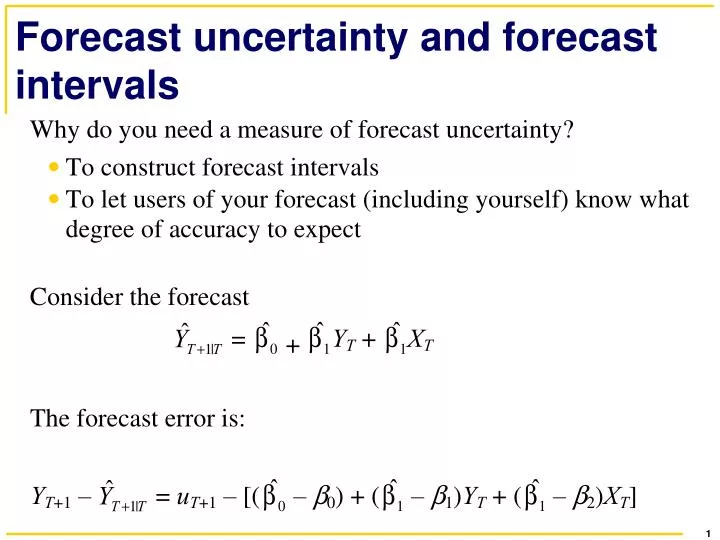
Forecast uncertainty and forecast intervals . Mean Squared Forecast Error. Three ways to estimate the RMSFE . Pseudo out-of-sample forecasting. Constructing forecast intervals . Example #1: the Bank of England “ Fan Chart ” , 11/05 .

zada
Download Presentation

Forecast uncertainty and forecast intervals

An Image/Link below is provided (as is) to download presentation Download Policy: Content on the Website is provided to you AS IS for your information and personal use and may not be sold / licensed / shared on other websites without getting consent from its author. Content is provided to you AS IS for your information and personal use only. Download presentation by click this link. While downloading, if for some reason you are not able to download a presentation, the publisher may have deleted the file from their server. During download, if you can't get a presentation, the file might be deleted by the publisher.

E N D

Presentation Transcript


  1. Forecast uncertainty and forecast intervals

  2. Mean Squared Forecast Error

  3. Three ways to estimate the RMSFE

  4. Pseudo out-of-sample forecasting

  5. Constructing forecast intervals

  6. Example #1: the Bank of England “Fan Chart”, 11/05

  7. Example #2: Monthly Bulletin of the European Central Bank, Dec. 2005, Staff macroeconomic projections

  8. Example #3: Fed, Semiannual Report to Congress, 7/04

  9. Lag Length Selection Using Information Criteria

  10. Bayes Information Criterion (BIC)

  11. Akaike Information Criterion (AIC)

  12. Example: AR model of inflation

  13. Generalization of BIC to multivariate (ADL) models

  14. Nonstationarity from Trends

  15. 1. What is a trend?

  16. Deterministic and stochastic trends

  17. Deterministic and stochastic trends

  18. Deterministic and stochastic trends

  19. Deterministic and stochastic trends

  20. Stochastic trends and unit roots

  21. Unit roots in an AR(2)

  22. Unit roots in an AR(2), ctd.

  23. Unit roots in the AR(p) model

  24. Unit roots in the AR(p) model, ctd.

  25. 2. What problems are caused by trends?

  26. Log Japan gdp (smooth line) and US inflation (both rescaled), 1965-1981

  27. Log Japan gdp (smooth line) and US inflation (both rescaled), 1982-1999

  28. 3. How do you detect trends?

  29. DF test in AR(1), ctd.

  30. Table of DF critical values

  31. The Dickey-Fuller test in an AR(p)

  32. When should you include a time trend in the DF test?

  33. Example: Does U.S. inflation have a unit root?

  34. Example: Does U.S. inflation have a unit root?

  35. DF t-statstic = –2.69 (intercept-only):

  36. 4. How to address and mitigate problems raised by trends

  37. Summary: detecting and addressing stochastic trends

  38. Nonstationarity from breaks (changes) in regression coefficients

  39. Case II: The break date is unknown

  40. The Quandt Likelihod Ratio (QLR) Statistic (also called the “sup-Wald” statistic)

  41. The QLR test, ctd.

  42. Has the postwar U.S. Phillips Curve been stable?

  43. QLR tests of the stability of the U.S. Phillips curve.

  44. Assessing Model Stability using Pseudo Out-of-Sample Forecasts

More Related