Download
1 / 56
560 likes | 697 Views
Real-World Hydrogen Technology Validation. ICHS 2011: T5 #217 S. Sprik, J. Kurtz, K. Wipke, T. Ramsden, C. Ainscough, L. Eudy, G. Saur September 12-14, 2011. Contents. NREL Hydrogen Technology Validation Overview of Tech Val Projects

E N D
Real-World HydrogenTechnology Validation ICHS 2011: T5 #217 S. Sprik, J. Kurtz, K. Wipke, T. Ramsden, C. Ainscough, L. Eudy, G. Saur September 12-14, 2011
Contents • NREL Hydrogen Technology Validation • Overview of Tech Val Projects • Selected Composite Data Products (CDPs) including Safety and Maintenance
NREL Tech Val – Who We Are, What We Do • Collection • Analysis • Collaboration • Reporting on Real World Operation Data from the Field and State of the Art Performance Data from the Lab Within NREL’s Hydrogen Technologies and Systems Center, the Technology Validationgroup works on confirming that technical targets have been achieved for components and systems under “Real World” conditions.
Energy Systems Integration Facility - ESIF (This is a rendering. Building completion expected in 2012) Rendering courtesy of Smith Group
Data Flow Supports both DOE/Public as Well as Fuel Cell Developers Bundled data (operation & maintenance/safety) delivered to NREL quarterly Internal analysis completed quarterly Results DDPs CDPs • Detailed Data Products (DDPs) • Individual data analyses • Identify individual contribution to CDPs • Only shared with partner who supplied data every 6 months1 • Composite Data Products (CDPs) • Aggregated data across multiple systems, sites, and teams • Publish analysis results without revealing proprietary data every 6 months2 Data exchange may happen more frequently based on data, analysis, & collaboration Results published via NREL Tech Val website, conferences, and reports
Analysis Tool • Code developed at NREL • Started out just for fuel cell cars and their infrastructure • Added other applications as they came along • Allows for batch processing • Select which analyses to perform and which projects to go into a CDP • Updated continuously
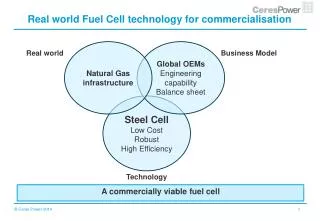
Technology Validation Demonstrations are essential for validating the performance oftechnologies in integrated systems, under real-world conditions.
FC Learning Demo Funding from DOE
FCEV Learning Demonstration Teams Teams through end of 2009 Teams through 2011
Two Sets of CDPs Through 2009Q4 After 2009Q4 • Most comprehensive set we ever published • Includes durability, range, fuel economy • Covers data from all 4 Learning Demo teams + CHIP project over 5-year period • Majority of these are now static, serving as a historical record of Gen 1 & Gen 2 comparisons. Spring 2011 80 Spring 2010 Results 23 Results • 5 new CDPs, and updated 18 previously published CDPs with data from last 12 months • Results on most recent durability, range, fuel economy, not yet possible to publish until more data accumulated (end of 2011) • Covers data from 2 Learning Demo OEMs + CHIP project • Emphasized changes observed between older data and the newer data
Technology Validation FCEV The Learning Demonstration has Exceeded Technical Goals for Driving Range and Fuel Cell Durability DOE Vehicle/Infrastructure DemonstrationFour teams in 50/50 cost-shared projects with DOE Fuel Cell Technologies Program • 155 fuel cell vehicles and 25 fueling stations demonstrated • More than 3 million miles traveled • More than 147,000 kg of hydrogen produced or dispensed* • Analysis by NREL shows: • Efficiency: 53 – 59%(>2x higher than gasoline internal combustion engines) • Range: ~196 – 254 miles • Fuel Cell System Durability: • ~ 2,500 hrs(~75,000 miles at 30 mph avg. speed) *includes hydrogen not used in the Program’s demonstration vehicles
Status: Out of 25 Project Stations, 13 Are Still Operational (3/5 outside of DOE project) * CDP station status is as of 12/31/10 SF Bay Area Detroit Area 9 2 Online 3 Future 9 6 4 Online DC to New York Los Angeles Area 54 Online 15 Future ** 6 Online 17 Online 11 Future 6 mile radius 3 mile radius ** Funded by state of CA or others, outside of this project Mar-31-2011
Safety Reports for FCEV Learning Demo • 13 events • 4 traffic accidents • 4 leaks during fueling
Definitions for Safety Reporting An incident is defined as an event that results in any of the following: • A lost-time accident and/or injury to personnel • Damage/unplanned downtime for project equipment, facilities, or property • Impact to the public or environment • Any hydrogen release that unintentionally ignites or is sufficient to sustain a flame if ignited • Release of any volatile, hydrogen-containing compound (other than the hydrocarbons used as common fuels) A near miss is defined as: • An event that, under slightly different circumstances, could have become an incident • An unplanned hydrogen release insufficient to sustain a flame
Safety Reports for FCEV Infrastructure 5 incidents
Safety Reports by Type Equipment malfunctions Significant H2 Release Leaks
Safety Reports Primary Factors Controls issue 2 operator error 2 design flaws
Backup Power, Material Handling Equipment Funding from DOE-ARRA, DLA
Summary of FC MHE Operation - ARRA FCMHE operating at end user facilities, accumulating many hours and hydrogen fills safely, and already showing productivity improvements. *Through December 2010
Summary of Backup Power System Operation Key Performance Metrics Reliability Low Emissions Low Noise Ease of Use Remote Monitoring * Through December 2010
ARRA Deployment >750
MHE Infrastructure Safety Reports Most incidents were dispenser hose break-away
DLA FC System Safety Reports Possible static discharge Short from power washing
FCMHE 42 CDPs • Results include • Units deployed, operation hours, & fuel cell operation trends • Hydrogen fill count, amount, time, & rate • Tank level at fill & downtime from fill • Fuel cell durability & reliability • Fuel cell and infrastructure maintenance events & safety reports
FC Bus Funding from DOE and DOT Federal Transit Administration
Technology Validation FCB FC Buses Are Demonstrating Long Life and Superior Fuel Economy Compared to their Diesel and CNG Baselines Traveled: >547,000 miles Dispensed: >96,000 kg H2 Fuel economy results: 41% to 132% better than diesel and CNG buses
Bus Safety • Break-away not functioning as intended • Tanks on top of bus increase height/center of gravity
Specific Safety Reports • Car accident • Vibrating machinery (cold) • Fire at a Fueling Station • Breakaways not operating as intended • FL water spill • FL fire power washing • FL evap pad caught on fire
Lessons learned from Safety Reports • First responders may need training more often or when new to area • Need to prevent drive-offs with hose still attached • Need systems to prevent incidents or near misses getting worse because of cascading events • Want technology to be transparent to user but there are differences that user needs to be aware of • Power washing of fuel cell forklift • Routine inspections are necessary to catch problems early • Make sure alarms are appropriate to the event to prevent over reaction. • Redundant checks to make sure maintenance is done properly • Fail-safe systems are working as intended
New CDPs Coming Soon • In the next round of CDPs (Oct 2011) Performance • More detailed durability CDPs Safety and Maintenance • Hydrogen leaks by equipment category • Hydrogen compressor failure modes • Mean time between safety events • Equipment category of safety events
Summary • Safety data collected from teams • Safety data reported in CDPs and available on NREL’s website • Incidents reported to H2Incidents.org when possible • Tech Val has seen a good safety record
Daimler F-Cell at NREL NREL’s Renewable H2Station, storing over 250 kg H2 and dispensing at 350 bar