Download
1 / 78
780 likes | 883 Views
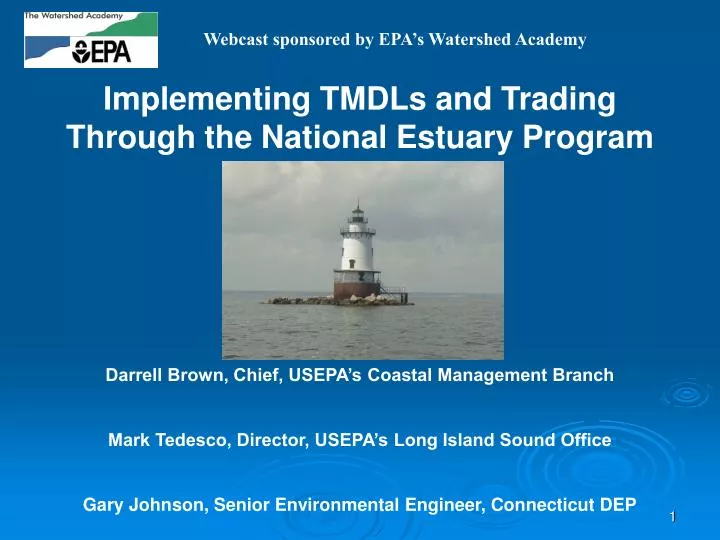
Webcast sponsored by EPA’s Watershed Academy. Implementing TMDLs and Trading Through the National Estuary Program. Darrell Brown, Chief, USEPA’s Coastal Management Branch Mark Tedesco, Director, USEPA’s Long Island Sound Office Gary Johnson, Senior Environmental Engineer, Connecticut DEP.

E N D
Webcast sponsored by EPA’s Watershed Academy Implementing TMDLs and Trading Through the National Estuary Program Darrell Brown, Chief, USEPA’s Coastal Management Branch Mark Tedesco, Director, USEPA’s Long Island Sound Office Gary Johnson, Senior Environmental Engineer, Connecticut DEP
What We’ll Cover • Overview of The National Estuary Program and lessons learned --Darrell Brown • Implementing the Long Island Sound TMDL: Flexibility through Effluent Trading--Mark Tedesco • Connecticut’s Nitrogen Trading Program -- Gary Johnson
National Estuary Program (NEP) • The National Estuary Program was established by Congress in 1987 - Section 320 of the CWA • 2007 marks the 20th Anniversary of the NEP! • The NEP’s mission is to identify, protect, and restore estuaries of national significance • Estuaries are the most biologically-productive ecosystems: • Over 75% of U.S. commercial fish catch and 80%-90% of U.S. recreational fish catch – estimated value $19 billion
National Estuary ProgramOverview • NEP is a model of a non-regulatory, stakeholder-driven, collaborative approach. The four cornerstones of which are: • Focus on watershed or ecosystem • Integration of good science with sound decision making • Collaborative problem solving • Involving the public
Comprehensive Conservation Management Plan (CCMP) • NEP stakeholders develop Comprehensive Conservation Management Plan (CCMP) to address priority problems • Each CCMP contains specific actions designed to protect the estuary and its resources – many actions call for implementation of the Clean Water Act at the local level (e.g., TMDLs) • EPA approves each CCMP, then NEP partners (State, community, business, environmental, scientific representatives) implement the plans
Puget Sound Lower Columbia River Casco Bay New Hampshire Estuaries Tillamook Bay Massachusetts Bay Buzzards Bay Narragansett Bay Peconic Bay Long Island Sound NY-NJ Harbor San Francisco Estuary Barnegat Bay Delaware Estuary Delaware Inland Bays Morro Bay Maryland Coastal Bay Albermarle-Pamlico Santa Monica Bay Year Entered the Program 1987 1988 1990 1993 Mobile Bay Indian River Lagoon Barataria-Terrebonne Galveston Bay 1995 San Juan Bay Corpus ChristiBay Tampa Bay Sarasota Bay Charlotte Harbor There are currently 28 estuaries in the program, representing 19 States and Puerto Rico. Estuaries in the Program
National Estuary Program:Ecosystem and Community Based Environmental Protection Agency Federal Agencies State Governments Ecosystem Educational Institutions Local Governments Scientific Community General Public Affected Users
NEP Networks Work! • Recent study* found the networks in NEP areas: • span more levels of government, • integrate more experts into policy discussions, • nurture stronger interpersonal ties between stakeholders, and • create greater faith in the procedural fairness of local policy *Building Consensual Institutions: Networks and the National Estuary Program, M. Schneider et. al., American Journal of Political Science, Vol. 47. No 1, January 2003.
Making a Difference Partners in the 28 National Estuary Programs are protecting estuaries by: • Protecting and restoring habitat • Working with farmers and homeowners to curb polluted runoff • Protecting human health from pathogens • Upgrading sewage treatment plants • Installing and improving septic systems • Educating and informing children and adults • Encouraging public involvement in estuary protection
Habitat and Leveraging Accomplishments • Since 2000, NEPs have protected and/or restored approximately 1 million acres of habitat • Since 2000, NEPs have averaged a leveraging ratio of 16:1
Leveraging Funds Through the NEP – Lessons Learned • Finance planning allows the NEPs to move from ad-hoc grants to strategic fundraising • Diversifying funding sources provides a buffer and leads to greater leveraging opportunities • Building the partnerships and public support necessary for leveraging takes time
NEP Lessons Learned 1. Community-based resource management can achieve results 2. Setting measurable environmental goals and indicators is important 3. Environmental and programmatic monitoring are critical
NEP Lessons Learned (cont.) 4. There are common coastal environmental problems and challenges 5. The NEPs are demonstrating the ability to address emerging issues 6. Obtaining sustainable levels of funding are key
Key Lesson Learned: Partnerships Are Key • EPA efforts complement and support work by a wide array of federal, State and local partners • Federal agency coordination • States, municipal government, landowners, and local watershedgroups
Community-Based Watershed Management Handbook • Establishing governance structures • Informing and involving people • Fostering collaboration • Using science • http://www.epa.gov/neplessons
Total Maximum Daily Loads (TMDLs) • A TMDL is the amount of a specific pollutant that a waterbody can receive and still meet water quality standards. • A TMDL is made up of the sum of all the point source loads (“wasteload allocation”) and load associated with nonpoint sources (“load allocation”). • Thus – a TMDL is the allowable amount of a single pollutant from all contributing point and nonpoint sources that a waterbody can receive and still meet water quality standards
TMDL/NEP Nexis • NEP projects develop strategies to help attain or maintain water quality standards --and can combine several TMDLs under one plan • Morro Bay Example • The NEP is the local watershed stakeholder organization for Morro Bay, and maintains a focus on improving water quality via TMDL implementation. • The CCMP is used for TMDL development both as a data source and as a TMDL implementation plan. Many of the adopted TMDLs look to specific Action Plans in our CCMP as the key steps towards achieving the TMDL, and cite the MBNEP as a primary implementer. • Morro Bay NEP monitoring program data has informed 303(d) listings, and is a primary ongoing data source for assessing the implementation progress of the adopted TMDLs for pathogens, sediment, and nutrients in the bay and watershed.
Challenges of Developing TMDLs in Coastal Waters • Large watersheds • Multi-jurisdictional watersheds • Complex systems (tidal, stratified, open boundaries, sediment fluxes) • Complex pollutants and ecosystem pathways • Nutrients, sediments, PCB, Mercury • Differing schedules and priorities • Reflect State priorities, litigation driven • Diverse WQSs, data, methodologies
Lessons Learned from the NEP Efficiencies Achieved by Promoting the Watershed Approach • Monitoring and data collection • Analyzing data and model development • EfficientTMDL calculation and pollutant reduction targeting • Consolidating document development and review • Involving the Public early and often • Implementing regulatory and voluntary controls • Achieving water quality standards as soon as possible at the least cost
Implementing the Long Island Sound Nitrogen TMDL: Flexibility through Effluent Trading Mark Tedesco, EPA Long Island Sound Office
Presentation Topics • LIS water quality status and trends • TMDL for nitrogen control • Use of watershed permits and trading • Progress in nitrogen control
What is the Long Island Sound Study? Sponsors US EPA CT Department of Environmental Protection NY State Department of Environmental Conservation
Hypoxia (Low Dissolved Oxygen) Results in Acute and Chronic Effects on Living Resources
Total Nitrogen Loads to LIS Have Greatly Increased and Are Dominated by Point Sources Natural nitrogen loads were much lower
Increased Nitrogen has Increased Production Burial of Carbon in Sediments has Increased (so has biogenic silica from diatoms, and shells of forams) Varekamp et al. 2004
Eelgrass has Declined from Historic Range Historical eelgrass distribution by town Current eelgrass distribution by town (in orange) LIS Eelgrass Survey 2002, US Fish & Wildlife Service
CWA Requirements for TMDLs • Identify “Water Quality Limited” Waters • Specify Allowable Pollutant Loading • Point Sources, Nonpoint Sources, Margin of Safety • Implement through: • standards, criteria, classification • regulations, permits
305 (b) assessments 303 (d) listings TMDLs Permits STPS, stormwater Nonpoint source controls Community-based Visioning, consensus building Integrate social, economic, and env. Objectives Flexible use of tools Adaptive management Management Challenge Clean Water Acting Clean Water Act
Technical Challenges in TMDL Implementation and Assessment • In-basin watershed • Overall five state watershed • Airshed
Key Issues Needed to be Addressed • Attainment of water quality standards • Technical basis for DO standard • High cost burden for POTW upgrades • Perceived equity between point and nonpoint sources • NYC vs. CT River • Uncertainty in managing out-of-basin loads
LIS Numerical Water Quality Modeling • Develop numerical models to support assessment • Water Quality • Hydrodynamics • Objectives: • assess effect of carbon and nitrogen inputs on dissolved oxygen balance • consider range of management scenarios
TMDL Approved April 2001 • A 58.5% reduction from primary anthropogenic sources in CT and NY • 10% reduction from urban and agricultural runoff (LA) • Balance (64% in CT, 59% in NY) from point sources (WLA) Modeling results predict significant water quality improvements
Key Implementation Issues • Cost estimates vary • Incentive for dischargers to inflate • Lack of incentives to do more, sooner • Disagreements over allocations • Lack of collaboration • Your permit, your problem • Phasing reductions over 15 years • Available funding, planning and construction timelines
Efficient Use of Capital Possible but Difficult Through Traditional Allocation and Permitting Process
Solution: Use Flexibility and Market Forces to Achieve Efficient Allocations • Set fifteen year goal with five year increments • Allocate equal reductions to each management zone and discharger • Permits containing final limits and 15 compliance schedules • Allow flexibility in how to achieve reductions within a zone and among facilities considering relative impacts (Trading ratios) • bubble permit (NY) • general permit (CT) and credit trading • Commit to five-year evaluations to update TMDL
TMDL Trading Ratios • Adjustments in WLA allowed consistent with TMDL exchange ratios • Watershed attenuation factors • Delivery to LIS • Derived from LIS water quality model and watershed calculations
0.17 0.14 0.32 0.19 0.46 0.18 0.93 1.00 0.11
100 80 100 20 100
New York Bubble Permits • Nitrogen "bubble" by management zone • aggregate, annual limit for point sources within a zone • individual, annual limit based on facility's share of aggregate, annual load • Monitoring and reporting requirements • Compliance for 12-month rolling average • Final WLA phased in five-year increments • Reallocation among zones allowed consist with TMDL equivalency factors
How it Works • Option of doing more at upper East River STPS and less at lower East River STPs • 1.9:1.0 trading ratio • Being updated to 4:1 ratio based on new SWEM model • NYCDEP and NYSDEC modified consent order for Newtown Creek STP to eliminate nitrogen control • Estimated savings of $600 million • NYCDEP and NYSDEC signed consent order on upper ER nitrogen control to meet TMDL • Revised agreement in 2005
Connecticut Public Act 01-180: An Act Concerning Nitrogen Reduction In Long Island Sound • Passed June 2001 • Authority to Issue a General Permit • Establish a Nitrogen Credit Advisory Board • Alternate Compliance Program
Point Source Nitrogen End-of-Pipe Discharge has Decreased by 25% Baseline nitrogen discharge TMDL 2014 reduction 58.5% goal CT DEP and NYSDEC
Estimated Nitrogen Load from All CT Coastal and Riverine Sources Data source: USGS & CT DEP
There are Annual Variations in the Maximum Area and Duration of Hypoxia, Primarily Due to Weather Hypoxia is defined as less than 3.0 mg/l CT DEP LIS Water Quality Monitoring Program
What Can We Learn from Empirical N Loading – N Concentration – DO Relationships? Composite of Axial Stations – Average Change over 15 Years • Total Nitrogen Load Trend Down by 28% • Surface TN Conc. Trend Down by 14% • Bottom TN Conc. Trend Down by 24% • Surface Chlorophyll-a Conc. Trend Down by 16% • Bottom Dissolved Oxygen Trend Up by 9%