Download
1 / 12
120 likes | 243 Views
1.) Colour in and label the area that shows natural increase. 2.) Which five year period had the highest natural increase? 3.) Suggest a reason for this. 4.) Which stage of the Demographic Model was NZ in at this time? 5.) Which five year period had the lowest natural increase?

E N D
1.) Colour in and label the area that shows natural increase. 2.) Which five year period had the highest natural increase? 3.) Suggest a reason for this. 4.) Which stage of the Demographic Model was NZ in at this time? 5.) Which five year period had the lowest natural increase? 6.) Suggest a reason for this. 7.) In 1880 what was NZ’s birth rate, death rate and rate of natural increase? 8.) What stage of demographic transition was NZ in at this time? 9.) In 2000 was was NZ’s birth rate, death rate and rate of natural increase? 10.) What stage of demographic transition was NZ in at this time?
1.) Colour in and label the area that shows natural increase. 2.) Which five year period had the highest natural increase? 1875 - 1880 3.) Suggest a reason for this. 4.) Which stage of the Demographic Model was NZ in at this time? 5.) Which five year period had the lowest natural increase? 6.) Suggest a reason for this. 7.) In 1880 what was NZ’s birth rate, death rate and rate of natural increase? 8.) What stage of demographic transition was NZ in at this time? 9.) In 2000 was was NZ’s birth rate, death rate and rate of natural increase? 10.) What stage of demographic transition was NZ in at this time?
1.) Colour in and label the area that shows natural increase. 2.) Which five year period had the highest natural increase? 1875 - 1880 3.) Suggest a reason for this. Young immigrants arrived and immediately had families 4.) Which stage of the Demographic Model was NZ in at this time? 5.) Which five year period had the lowest natural increase? 6.) Suggest a reason for this. 7.) In 1880 what was NZ’s birth rate, death rate and rate of natural increase? 8.) What stage of demographic transition was NZ in at this time? 9.) In 2000 was was NZ’s birth rate, death rate and rate of natural increase? 10.) What stage of demographic transition was NZ in at this time?
1.) Colour in and label the area that shows natural increase. 2.) Which five year period had the highest natural increase? 1875 - 1880 3.) Suggest a reason for this. Young immigrants arrived and immediately had families 4.) Which stage of the Demographic Model was NZ in at this time? Stage 2 – high birth rate & falling death rate 5.) Which five year period had the lowest natural increase? 6.) Suggest a reason for this. 7.) In 1880 what was NZ’s birth rate, death rate and rate of natural increase? 8.) What stage of demographic transition was NZ in at this time? 9.) In 2000 was was NZ’s birth rate, death rate and rate of natural increase? 10.) What stage of demographic transition was NZ in at this time?
1.) Colour in and label the area that shows natural increase. 2.) Which five year period had the highest natural increase? 1875 - 1880 3.) Suggest a reason for this. Young immigrants arrived and immediately had families 4.) Which stage of the Demographic Model was NZ in at this time? Stage 2 – high birth rate & falling death rate 5.) Which five year period had the lowest natural increase? 1915 - 1920 6.) Suggest a reason for this. 7.) In 1880 what was NZ’s birth rate, death rate and rate of natural increase? 8.) What stage of demographic transition was NZ in at this time? 9.) In 2000 was was NZ’s birth rate, death rate and rate of natural increase? 10.) What stage of demographic transition was NZ in at this time?
1.) Colour in and label the area that shows natural increase. 2.) Which five year period had the highest natural increase? 1875 - 1880 3.) Suggest a reason for this. Young immigrants arrived and immediately had families 4.) Which stage of the Demographic Model was NZ in at this time? Stage 2 – high birth rate & falling death rate 5.) Which five year period had the lowest natural increase? 1915 - 1920 6.) Suggest a reason for this. World War I and the Influenza epidemic 7.) In 1880 what was NZ’s birth rate, death rate and rate of natural increase? 8.) What stage of demographic transition was NZ in at this time? 9.) In 2000 was was NZ’s birth rate, death rate and rate of natural increase? 10.) What stage of demographic transition was NZ in at this time?
1.) Colour in and label the area that shows natural increase. 2.) Which five year period had the highest natural increase? 1875 - 1880 3.) Suggest a reason for this. Young immigrants arrived and immediately had families 4.) Which stage of the Demographic Model was NZ in at this time? Stage 2 – high birth rate & falling death rate 5.) Which five year period had the lowest natural increase? 1915 - 1920 6.) Suggest a reason for this. World War I and the Influenza epidemic 7.) In 1880 what was NZ’s birth rate, death rate and rate of natural increase? 38 per 1,000; 12 per 1,000; 26 per 1,000 2.6% 8.) What stage of demographic transition was NZ in at this time? 9.) In 2000 was was NZ’s birth rate, death rate and rate of natural increase? 10.) What stage of demographic transition was NZ in at this time?
1.) Colour in and label the area that shows natural increase. 2.) Which five year period had the highest natural increase? 1875 - 1880 3.) Suggest a reason for this. Young immigrants arrived and immediately had families 4.) Which stage of the Demographic Model was NZ in at this time? Stage 2 – high birth rate & falling death rate 5.) Which five year period had the lowest natural increase? 1915 - 1920 6.) Suggest a reason for this. World War I and the Influenza epidemic 7.) In 1880 what was NZ’s birth rate, death rate and rate of natural increase? 38 per 1,000; 12 per 1,000; 26 per 1,000 2.6% 8.) What stage of demographic transition was NZ in at this time? Stage 3 – low death rate & falling birth rate 9.) In 2000 was was NZ’s birth rate, death rate and rate of natural increase? 10.) What stage of demographic transition was NZ in at this time?
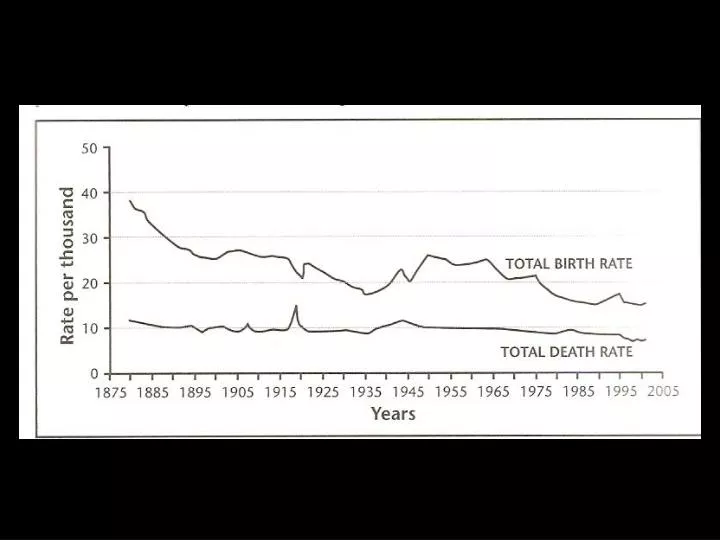
1.) Colour in and label the area that shows natural increase. 2.) Which five year period had the highest natural increase? 1875 - 1880 3.) Suggest a reason for this. Young immigrants arrived and immediately had families 4.) Which stage of the Demographic Model was NZ in at this time? Stage 2 – high birth rate & falling death rate 5.) Which five year period had the lowest natural increase? 1915 - 1920 6.) Suggest a reason for this. World War I and the Influenza epidemic 7.) In 1880 what was NZ’s birth rate, death rate and rate of natural increase? 38 per 1,000; 12 per 1,000; 26 per 1,000 2.6% 8.) What stage of demographic transition was NZ in at this time? Stage 3 – low death rate & falling birth rate 9.) In 2000 was was NZ’s birth rate, death rate and rate of natural increase? 16 per 1,000; 9 per 1,000; 7 per 1,000 0.7% 10.) What stage of demographic transition was NZ in at this time?
1.) Colour in and label the area that shows natural increase. 2.) Which five year period had the highest natural increase? 1875 - 1880 3.) Suggest a reason for this. Young immigrants arrived and immediately had families 4.) Which stage of the Demographic Model was NZ in at this time? Stage 2 – high birth rate & falling death rate 5.) Which five year period had the lowest natural increase? 1915 - 1920 6.) Suggest a reason for this. World War I and the Influenza epidemic 7.) In 1880 what was NZ’s birth rate, death rate and rate of natural increase? 38 per 1,000; 12 per 1,000; 26 per 1,000 2.6% 8.) What stage of demographic transition was NZ in at this time? Stage 3 – low death rate & falling birth rate 9.) In 2000 was was NZ’s birth rate, death rate and rate of natural increase? 16 per 1,000; 9 per 1,000; 7 per 1,000 0.7% 10.) What stage of demographic transition was NZ in at this time? Stage 4 – low birth rate & low death rate; stable rates