Download
1 / 4
40 likes | 127 Views
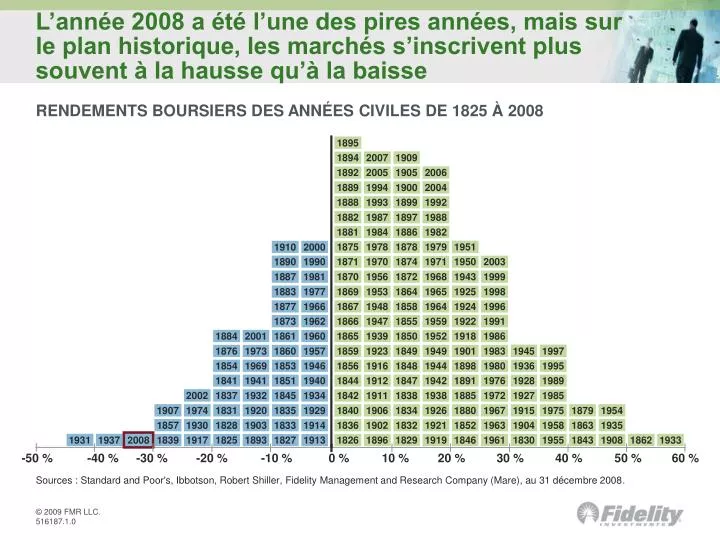
L’année 2008 a été l’une des pires années, mais sur le plan historique, les marchés s’inscrivent plus souvent à la hausse qu’à la baisse. RENDEMENTS BOURSIERS DES ANNÉES CIVILES DE 1825 À 2008. 1895. 1894. 2007. 1909. 1892. 2005. 1905. 2006. 1889. 1994. 1900. 2004. 1888. 1993. 1899.

E N D
L’année 2008 a été l’une des pires années, mais sur le plan historique, les marchés s’inscrivent plus souvent à la hausse qu’à la baisse RENDEMENTS BOURSIERS DES ANNÉES CIVILES DE 1825 À 2008 1895 1894 2007 1909 1892 2005 1905 2006 1889 1994 1900 2004 1888 1993 1899 1992 1882 1987 1897 1988 1881 1984 1886 1982 1875 1978 1878 1979 1951 1910 2000 1890 1990 1871 1970 1874 1971 1950 2003 1887 1981 1870 1956 1872 1968 1943 1999 1883 1977 1869 1953 1864 1965 1925 1998 1877 1966 1867 1948 1858 1964 1924 1996 1873 1962 1866 1947 1855 1959 1922 1991 1884 2001 1861 1960 1865 1939 1850 1952 1918 1986 1876 1973 1860 1957 1859 1923 1849 1949 1901 1983 1945 1997 1854 1969 1853 1946 1856 1916 1848 1944 1898 1980 1936 1995 1841 1941 1851 1940 1844 1912 1847 1942 1891 1976 1928 1989 2002 1837 1932 1845 1934 1842 1911 1838 1938 1885 1972 1927 1985 1907 1974 1831 1920 1835 1929 1840 1906 1834 1926 1880 1967 1915 1975 1879 1954 1857 1930 1828 1903 1833 1914 1836 1902 1832 1921 1852 1963 1904 1958 1863 1935 1931 1937 2008 1839 1917 1825 1893 1827 1913 1826 1896 1829 1919 1846 1961 1830 1955 1843 1908 1862 1933 -50 % -40 % -30 % -20 % -10 % 0 % 10 % 20 % 30 % 40 % 50 % 60 % Sources : Standard and Poor's, Ibbotson, Robert Shiller, Fidelity Management and Research Company (Mare), au 31 décembre 2008.
Envisagez la situation dans son ensemble MARASMES ET REPRISES DU MARCHÉ CANADIEN DE 1960 À 2008 1 000 000 $ Août 2007 – ? Baisse totale : 38 % Reprise du marché en ? mois Août 2000 à sept. 2002 (25 mois) Baisse totale : 43 % Reprise du marché en 59 mois Juillet 1987 à novembre 1987 (4 mois) Baisse totale : 25 % Reprise du marché en 20 mois 100 000 $ 80 550 $ Octobre 1973 à septembre 1974 (11 mois) Baisse totale : 34,9 % Reprise du marché en 54 mois Avril 1998 à août 1998 (4 mois) Baisse totale : 27 % Reprise du marché en 15 mois Décembre 1989 à octobre 1990 (10 mois) Baisse totale : 20 % Reprise du marché en 29 mois 10 000 $ Juin 1981 à juin 1982 (12 mois) Baisse totale : 39 % Reprise du marché en 22 mois Placement initial de1 000 $ 1 000 $ Source : Ibbotson. Rendements totaux de l’indice composé S&P/TSX de janvier 1960 à décembre 2008.
Les retardataires risquent de manquer le bateau INDICE DOW JONES DES VALEURS INDUSTRIELLES MARCHÉS BAISSIERS ET HAUSSIERS DE 1960 À DÉCEMBRE 2008 Source : Ned Davis Research Inc., Fidelity Management and Research Co. au 31 déc. 2008
Cycle des émotions des investisseurs Risque financier maximal Wow, je suis optimiste à l’égard de ce placement Recul temporaire; j’investis à long terme Euphorie Anxiété Allégresse Déni de la réalité Enthousiasme Peur Optimisme Désespoir Occasions de gains maximales Optimisme Panique Soulagement Espoir Je n’ai peut-être pas la trempe d’un investisseur Capitulation Dépression Découragement Source : Westcore Funds / Denver Investment Advisors LLC, 1998