Download
1 / 25
250 likes | 253 Views
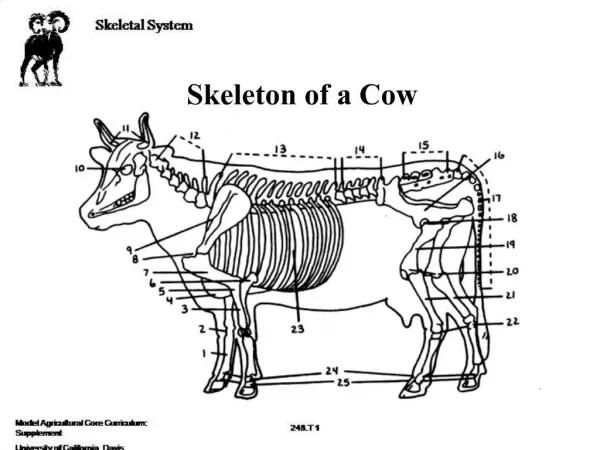
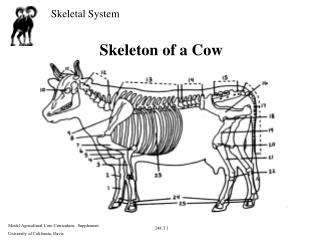
Adding charts anywhere Assume a cow is a sphere. Cindy Grimm and John Hughes, “ Parameterizing n-holed tori ”, Mathematics of Surfaces X, 2003 Cindy Grimm, “ Parameterization using Manifolds”, International Journal of Shape Modelling, 2004. Motivation.

E N D
Adding charts anywhereAssume a cow is a sphere Cindy Grimm and John Hughes, “Parameterizing n-holed tori”, Mathematics of Surfaces X, 2003 Cindy Grimm, “Parameterization using Manifolds”, International Journal of Shape Modelling, 2004
Motivation • Surface modeling: Adding more degrees of freedom • Don’t want to be restricted to existing charts/dof • Computers support vectors (points in Rn) • Functions on Rn • Splines, gradient descent algorithms • Define functions directly on sphere? • BRDFs, environment maps Siggraph 2005, 8/1/2005 www.cs.wustl.edu/~cmg/Siggraph2005/siggraph.html
Observation • We can define lots of meshes that are spheres • Which one’s the “right” one? • How do you compare two sphere meshes? Siggraph 2005, 8/1/2005 www.cs.wustl.edu/~cmg/Siggraph2005/siggraph.html
Approach • Find a computationally tractable way to represent some common domains • E.g., sphere, torus, plane • Doesn’t depend on any particular geometry • Questions to answer: • What is a point? (Convert from Rn to domain) • Movement in domain • Barycentric coordinates, linear interpolation Siggraph 2005, 8/1/2005 www.cs.wustl.edu/~cmg/Siggraph2005/siggraph.html
Once we have a domain… • Add charts. Anywhere. • Not restricted by existing atlas/construction • Questions to answer: • Chart specification? • Chart function form? Siggraph 2005, 8/1/2005 www.cs.wustl.edu/~cmg/Siggraph2005/siggraph.html
Applications • Surface modeling, texture mapping • Surface comparison, feature parameterization • Sphere: environment maps, BRDFs • Arbitrary chart placement • Port existing tools (linear embedding functions, gradient descent algorithms, etc.) to any domain transparently • Adaptive parameterization Siggraph 2005, 8/1/2005 www.cs.wustl.edu/~cmg/Siggraph2005/siggraph.html
Outline • Spherical domain • Defining • Adding charts • Building embedding function (surface • Torus, n-holed tori domains • Torus: Tiled plane • N-holed: Tiled plane, sort-of Siggraph 2005, 8/1/2005 www.cs.wustl.edu/~cmg/Siggraph2005/siggraph.html
Atlas from mesh • Embed mesh in domain • 1-1 correspondence • Specifies both chart locations and chart embeddings Sketch Embedded sketch Vertex charts Surface Siggraph 2005, 8/1/2005 www.cs.wustl.edu/~cmg/Siggraph2005/siggraph.html
In contrast… • Approaches presented earlier created abstract manifold from scratch • Specify transition functions/overlaps • Chart functions derived • Charts exactly match mesh connectivity • This approach • Define chart functions • Transition functions/overlaps are derived • Charts loosely tied to mesh connectivity • Both approaches fit geometry to subdivision surface Siggraph 2005, 8/1/2005 www.cs.wustl.edu/~cmg/Siggraph2005/siggraph.html
Representing a sphere • Representing points • x2+y2+z2 -1 = 0 • Average/blend points • Project back onto sphere (Gnomonic projection) • Valid in ½ hemisphere • Barycentric coordinates in spherical triangles • Interpolate in triangle, project • Line segments (arcs) Siggraph 2005, 8/1/2005 www.cs.wustl.edu/~cmg/Siggraph2005/siggraph.html
Charts • Stereographic projection • Sketch mesh charts • Circles to circles • Requires rotation to center at arbitrary point • Both C¥ Images: mathworld.wolfram.com Siggraph 2005, 8/1/2005 www.cs.wustl.edu/~cmg/Siggraph2005/siggraph.html
Charts, adjusting • Raw projections MD don’t provide much control • Map to consistent chart shape (e.g., unit disk) • Add additional “warp” function MW • Projective transform (scale, translate, rotate) • StillC¥ Siggraph 2005, 8/1/2005 www.cs.wustl.edu/~cmg/Siggraph2005/siggraph.html
Overlaps and transition functions • Overlaps • Chart inverse functions well-defined, C¥, over chart range/disk (but not over entire plane) • Coverage of chart determined by inverse map • Disk->sphere • Transition functions • Defined by composition a(a-1(s,t)) Siggraph 2005, 8/1/2005 www.cs.wustl.edu/~cmg/Siggraph2005/siggraph.html
Sketch atlas • Properties • Charts must cover sphere • Overlap substantially with neighbors • But not non-adjacent elements • Relate to sketch mesh • One chart for each vertex, edge, face • Vertex: centered, overlaps ½ adjacent edges/faces • Edge: covers end points, centroids of adjacent faces • Face: covers interior of face Vertex charts Edge charts Face charts Siggraph 2005, 8/1/2005 www.cs.wustl.edu/~cmg/Siggraph2005/siggraph.html
Creating embedding • Mesh in 1-1 correspondence with sphere • Subdivide original 3D mesh and mesh embedded in domain • Keeps correspondences • Fit chart embedding to corresponding part of subdivision surface Siggraph 2005, 8/1/2005 www.cs.wustl.edu/~cmg/Siggraph2005/siggraph.html
Blend and embedding functions • Blend: Uniform B-Spline basis function “spun” around origin • Produces smallest second derivative variations • Embed: C6 polynomial • No problems with end-conditions, skew • Continuity: Continuity of blend functions (everything else is C¥) Siggraph 2005, 8/1/2005 www.cs.wustl.edu/~cmg/Siggraph2005/siggraph.html
Advantages • Transition functions are “free”, C¥ • No difficulties with co-cycle condition • Can add additional charts anywhere • Embedding function provides a natural mechanism for “masking out” original surface • Mask out blend functions • Ck surface pasting with no constraints • Re-parameterization is easy • Take out old charts and add new ones Siggraph 2005, 8/1/2005 www.cs.wustl.edu/~cmg/Siggraph2005/siggraph.html
Disadvantages • Need to make/find canonical manifold for each genus • May prove difficult for higher dimensions • Requires “tweaking” of chart construction to get “nice” overlaps, guaranteed coverage • Regularization of embedded sketch mesh • Heuristics/optimizations for chart construction • Warping function Siggraph 2005, 8/1/2005 www.cs.wustl.edu/~cmg/Siggraph2005/siggraph.html
Torus • Similar to circle example • Repeat in both s and t: [0,2p) X [0,2p) • Chart is defined by projective transform • Care with wrapping (2p,2p ) X X (0,0) Siggraph 2005, 8/1/2005 www.cs.wustl.edu/~cmg/Siggraph2005/siggraph.html
Torus, associated edges • Cut torus open to make a square • Two loops (yellow one around, grey one through) • Each loop is 2 edges on square • Glue edges together • Loops meet at a point Siggraph 2005, 8/1/2005 www.cs.wustl.edu/~cmg/Siggraph2005/siggraph.html
b a a b d c c d N-Holed tori • Similar to torus – cut open to make a 4N-sided polygon • Two loops per hole (one around, one through) • Glue two polygon edges to make loop • Loops meet at a point • Polygon vertices glue to same point Front Back Siggraph 2005, 8/1/2005 www.cs.wustl.edu/~cmg/Siggraph2005/siggraph.html
Hyperbolic geometry • Why is my polygon that funny shape? • Need corners of polygon to each have 2p / 4N degrees (so they fill circle when glued together) • Tile hyperbolic disk with 4N-sided polygons Siggraph 2005, 8/1/2005 www.cs.wustl.edu/~cmg/Siggraph2005/siggraph.html
Hyperbolic geometry • Edges are circle arcs; circles meet boundary at right angles • Linear fractional transforms • Equivalent to matrix operations in Euclidean geometry, e.g., rotate, translate, scale • Invertible • Chart: Use a Linear fractional transform to map point(s) to origin, then apply warp function • Need to ensure we use correct copy in chart function Siggraph 2005, 8/1/2005 www.cs.wustl.edu/~cmg/Siggraph2005/siggraph.html
Summary • There are some manifolds we use often • Sphere, tori, circle, plane, S3 (quaternions) • Construct a general-purpose manifold + atlas + chart creation + transition functions • Now can use any tools that operate in Rn • Use same tools for all topologies • Can build charts at any scale, anywhere • Not dictated by initial construction/sketch Siggraph 2005, 8/1/2005 www.cs.wustl.edu/~cmg/Siggraph2005/siggraph.html
Open questions • Boundaries • Function discontinuities • Changing topologies • Establishing correspondences between existing surfaces and canonical manifold • Parameterization (next section) • Where and how to place charts Siggraph 2005, 8/1/2005 www.cs.wustl.edu/~cmg/Siggraph2005/siggraph.html