Download
1 / 13
180 likes | 215 Views
Straight Lines. Objectives: E Grade Plot the graphs of straight lines such as x = 3 and y = 4 Complete a table of values for equations such as y = 3 x + 1 and draw the graph. D Grade Solve problems involving graphs, such as finding

E N D
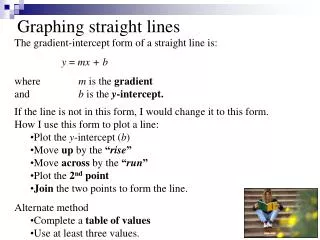
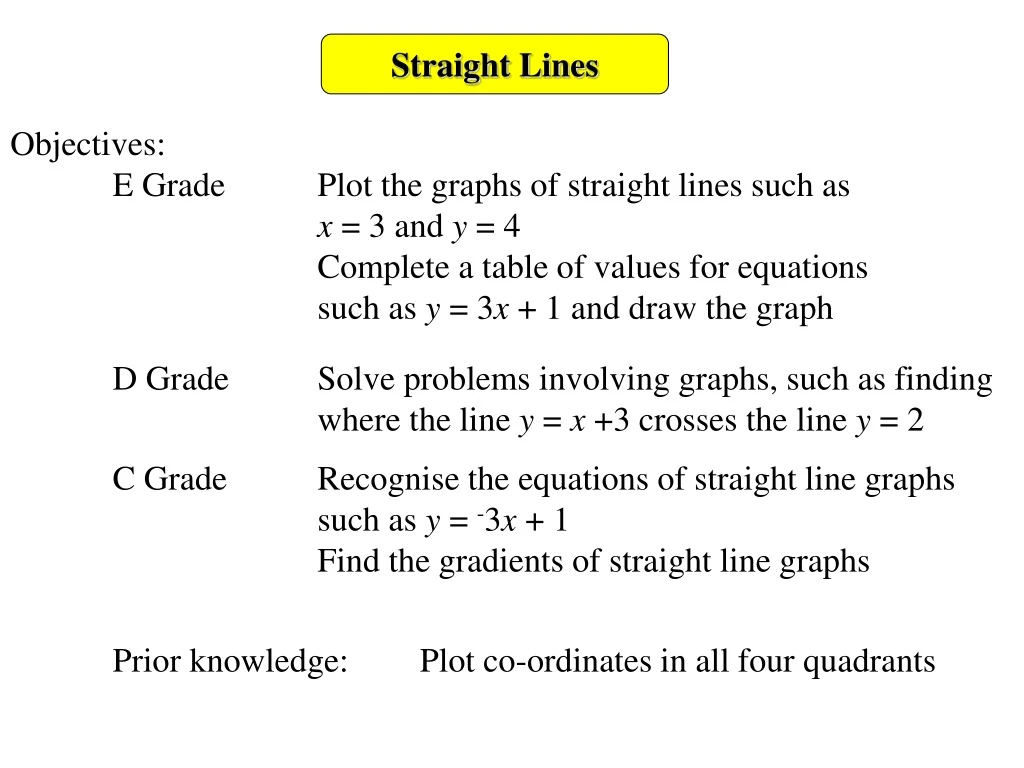
Straight Lines Objectives: E Grade Plot the graphs of straight lines such as x = 3 and y = 4 Complete a table of values for equations such as y = 3x + 1 and draw the graph D Grade Solve problems involving graphs, such as finding where the line y = x +3 crosses the line y = 2 C Grade Recognise the equations of straight line graphs such as y = -3x + 1 Find the gradients of straight line graphs Prior knowledge: Plot co-ordinates in all four quadrants
Try these: Using the value given for x, calculate the value for y y = x + 2 for x = 2 y = x + 10 for x = 3 y = x + 3 for x = -6 y = x – 2 for x = 3 y = x -3 for x = -3 y = 2x - 5 for x = 5 y = -3x -5 for x = 2.5 y = -6x + 5 for x = -3.5 Straight Lines In order to plot straight lines we must be able to substitute numbers into an equation in order to calculate a value. y = 4 y = 13 y = -3 y = 1 y = -6 y = 5 y = -12.5 y = 26
Straight Lines When given an equation and told to plot a graph, first find coordinates of points on the line, this is done by completing a table. By substituting the given values for x calculate the y value for the following equation: y = x + 2 -1 0 1 3 5 2 4 This generates coordinates to plot on a graph (-3,-1) (0, 2) (1, 3) (-2,0) (-1, 1) (2, 4) (0, 2) (3, 5)
y 10 9 8 7 6 5 4 3 2 1 x 0 -10 1 2 3 4 5 6 7 9 10 -9 -8 -6 -4 -3 -2 8 -7 -5 -1 -1 -2 -3 -4 -5 -6 -7 -8 -9 -10 Plotting these points Straight Lines (-3,-1) (0, 2) (1, 3) (-2,0) (-1, 1) (2, 4) (0, 2) (3, 5) x x x x x x We find a straight line x x
y 10 9 8 7 6 5 4 3 2 1 x 0 -10 1 2 3 4 5 6 7 9 10 -9 -8 -6 -4 -3 -2 8 -7 -5 -1 -1 -2 -3 -4 -5 -6 -7 -8 -9 -10 Straight Lines Copy and complete this table for the following equation and plot the straight line x y = 3x - 1 -10 -1 2 8 -4 x x x x
y 10 9 8 7 6 5 4 3 2 1 x 0 -10 1 2 3 4 5 6 7 9 10 -9 -8 -6 -4 -3 -2 8 -7 -5 -1 -1 -2 -3 -4 -5 -6 -7 -8 -9 -10 Complete the table for the equation y = x Straight Lines Plot the coordinates When the table is completed -1 0 3 -3 1 Complete the table for the equation y = x +1 0 1 4 -2 2 x x x x Complete the table for the equation y = x + 3 x x x x x x x x x x x x x x x x 2 3 6 0 4 Complete the table for the equation y = x - 2 1 -1 -2 -3 -5
y 10 9 8 7 6 5 4 3 2 1 x 0 -10 1 2 3 4 5 6 7 9 10 -9 -8 -6 -4 -3 -2 8 -7 -5 -1 -1 -2 -3 -4 -5 -6 -7 -8 -9 -10 Straight Lines What do you notice about these straight lines? y = x y = x + 1 y = x + 3 y = x - 2 x x x x They are parallel to each other i.e. they have the same gradient x x x x x x x x x x x x x x x x The number added to x is where the line crosses the y axis
y 10 9 8 7 6 5 4 3 2 1 x 0 -10 1 2 3 4 5 6 7 9 10 -9 -8 -6 -4 -3 -2 8 -7 -5 -1 -1 -2 -3 -4 -5 -6 -7 -8 -9 -10 Straight Lines We start with the line y = x y = x + 1 To become To become y = x + 4 The line moves up by 1 and crosses the y axis at 1 Start again with the line y = x The line moves up by 4 and crosses the y axis at 4
y 10 9 8 7 6 5 4 3 2 1 x 0 -10 1 2 3 4 5 6 7 9 10 -9 -8 -6 -4 -3 -2 8 -7 -5 -1 -1 -2 -3 -4 -5 -6 -7 -8 -9 -10 Straight Lines Write the equations of these lines? y = x + 6 y = x + 2 y = x - 1 y = x - 5 y = x - 9 1 2 3 4 5 1 2 3 4 5
Straight Lines To summarise for where a line crosses the y-axis Known as the y intercept For any equation in the form y = x + c The variable c can be + or - c is where the line crosses the y axis
y 10 9 8 7 6 5 4 3 2 1 x 0 -10 1 2 3 4 5 6 7 9 10 -9 -8 -6 -4 -3 -2 8 -7 -5 -1 -1 -2 -3 -4 -5 -6 -7 -8 -9 -10 Straight Lines
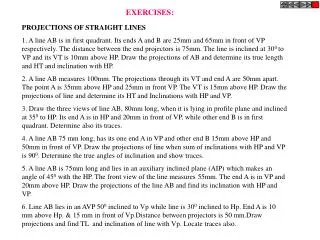
Worksheet 1 y 10 9 8 7 6 5 4 3 2 1 x 0 -10 1 2 3 4 5 6 7 9 10 -9 -8 -6 -4 -3 -2 8 -7 -5 -1 -1 -2 -3 -4 -5 -6 -7 -8 -9 -10 Complete the table for the equation y = x Straight Lines Plot the coordinates When the table is completed Complete the table for the equation y = x +1 Complete the table for the equation y = x + 3 Complete the table for the equation y = x - 2
Worksheet 2 y 10 9 8 7 6 5 4 3 2 1 x 0 -10 1 2 3 4 5 6 7 9 10 -9 -8 -6 -4 -3 -2 8 -7 -5 -1 -1 -2 -3 -4 -5 -6 -7 -8 -9 -10 Straight Lines Write the equations of these lines? 1 2 3 4 5 1 2 3 4 5