Download
1 / 10
100 likes | 193 Views
Infrastructure Responses to SDPs Evaluation of Priority Areas (“Priority Areas” – Released for Development 2010-2015) July 2009. Infrastructure Responses to SDPs Evaluation of Priority Areas Spatial Development Plan. Tongaat Residential. Infrastructure Responses to SDPs

E N D
Infrastructure Responses to SDPs Evaluation of Priority Areas (“Priority Areas” – Released for Development 2010-2015) July 2009
Infrastructure Responses to SDPs Evaluation of Priority Areas Spatial Development Plan
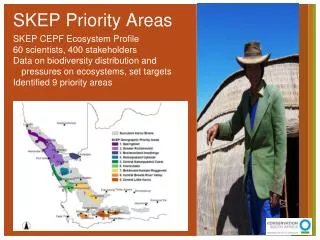
Tongaat Residential Infrastructure Responses to SDPs Evaluation of Priority Areas Priority Areas Canelands iQadi Fredville Redcliffe Tongaat Industrial Molweni KwaXimba Dube Trade Port Cato Ridge / Harrison Flats Hillcrest Bartletts Estate Cornubia Bridge City Mpumalanga Hammarsdale Shongweni Umlazi Zwelibomvu Amanzimtoti Inwabi Folweni Lovu Adam’s Mission Umgababa Craigieburn
Red: Lack of infrastructure will be a “showstopper” Infrastructure Responses to SDPs Evaluation of Priority Areas North Orange: Development can take place following some “simple” interventions Tongaat Residential Tongaat Industrial Green: Development can, in principle, occur immediately, as there is capacity available Dube Trade Port Canelands Redcliffe Cornubia Bridge City
Infrastructure Responses to SDPs Evaluation of Priority Areas North R123m represents total infrastructure cost to service full development footprint Tongaat Residential Tongaat Industrial Sewer: Orange indicates “Simple” Interventions required to release development. Total sewer infrastructure cost for full development footprint = R95m Roads: Green indicates no additional bulk road infrastructure required to release development. Total additional bulk roads infrastructure cost for full development footprint = R0m Dube Trade Port Canelands Tongaat Residential R123m Redcliffe S R Water: Red indicates lack of water infrastructure will be a “Showstopper” to release of development Total water infrastructure cost for full development footprint = R18m Electricity: Green indicates no additional bulk electricity infrastructure required to release development. Total additional bulk electricity infrastructure cost for full development footprint = R0m Cornubia 95 0 W E Bridge City 18 0 Red Outline indicates overall infrastructure index of “Showstopper”.
Prioritisation • Easy wins- infra capacity present for devt up to a cut-off after which high costs kick in • Rates Return/Infra Spend • Social Rank • Economic Rank • Revenue Generating vs Non-revenue generating land uses. Bringing in ratios.
Redcliffe Infrastructure Responses to SDPs Evaluation of Priority Areas North Cornubia Tongaat Residential Tongaat Industrial Bridge City Dube Trade Port Canelands Dube Trade Port – Phase B R863m Dube Trade Port – All Phases R1 152m Dube Trade Port – Phase A R289m Redcliffe R73m Tongaat Residential R123m Bridge City R60m Tongaat Industrial R0m Canelands– All Phases R59m Cornubia– Phase B R459m Canelands– Phase B R14m Cornubia– All Phases R668m Cornubia– Phase A R209m Canelands– Phase A R45m Redcliffe S S S S S S S S S S S S S R R R R R R R R R R R R R Cornubia 428 0 95 25 0 453 0 4 147 147 0 4 35 105 30 405 20 210 365 10 260 615 0 0 0 0 W W W W W W W W W W W W W E E E E E E E E E E E E E Bridge City 0 25 62 0 30 32 0 18 52 25 0 52 0 38 0 0 0 22 0 104 52 22 0 0 52 60
Infrastructure Responses to SDPs Evaluation of Priority Areas Outer West iQadi KwaXimba Fredville Molweni R42m Cato Ridge – Phase C R5 090m (?) iQadi R15m Hillcrest R21m Zwelibomvu R75m Mpumalanga R10m (w/o Eskom) Cato Ridge – Phase A R168m (w/o Eskom) Shongweni – All Phases R375m (w/o Eskom) Shongweni - Phase A R354m (w/o Eskom) Fredville R104m (w/o Eskom) KwaXimba R4m (w/o Eskom) Hammarsdale R187m (w/o Eskom) Bartletts Estate R328m (w/o Eskom) Cato Ridge – Phase B R710m Shongweni - Phase B R21m Cato Ridge – All Phases R6 052m (?) (w/o Eskom) Cato Ridge – Phase D R84m Cato Ridge / Harrison Flats Molweni S S S S S S S S S S S S S S S S S R R R R R R R R R R R R R R R R R Bartletts Estate Hillcrest Mpumalanga 48 0 80 21 125 240 50 21 15 0 10 104 0 100 0 92 147 5 700 (?) 5 000 (?) 0 250 0 0 0 0 10 0 250 10 250 0 0 700 0 Hammarsdale Shongweni W W W W W W W W W W W W W W W W W E E E E E E E E E E E E E E E E E Zwelibomvu 0 0 4 42 0 30 112 4 30 0 68 0 12 0 0 0 40 Eskom (?) Eskom(?) Eskom (?) 0 Eskom (?) Eskom (?) 0 Eskom (?) 0 0 75 Eskom (?) Eskom (?) Eskom 0 0 0
Infrastructure Responses to SDPs Evaluation of Priority Areas South Inwabi Umlazi Golokodo Umbumbulu Craigieburn – Phase B R34m Craigieburn – Phase A R117m (w/o Eskom) Umgababa R45m (w/o Eskom) Lovu R55m Amanzimtoti R0m Umbumbulu R38m Golokodo R61m Inwabi R23m Craigieburn – Phase C R24m Craigieburn – All Phases R175m (w/o Eskom) Umlazi R0m S S S S S S S S S S S R R R R R R R R R R R Amanzimtoti Lovu 105 0 23 135 0 33 23 0 24 43 6 0 0 0 0 0 0 0 0 0 0 0 Umgababa W W W W W W W W W W W E E E E E E E E E E E 0 0 40 0 12 12 12 0 0 0 28 0 Eskom (?) Eskom (?) 0 Eskom (?) 0 0 38 38 0 60 Craigieburn
Infrastructure Responses to SDPs Evaluation of Priority Areas (“Priority Areas” – Released for Development 2010-2015) July 2009