Download
1 / 12
120 likes | 313 Views
DEMAND MANAGEMENT Customer Metering – the Samoa Experience . Apia Urban Supply 1995 – 2002. SAMOA ISLANDS. Volcanic – 2 main islands Rainfall 2100-7000mm (wet period) Population – 175,000 (2001 Census). SAMOA WATER AUTHORITY. Corporatized 1994 Move towards financial independence

E N D
DEMAND MANAGEMENT Customer Metering – the Samoa Experience Apia Urban Supply 1995 – 2002
SAMOA ISLANDS • Volcanic – 2 main islands • Rainfall 2100-7000mm (wet period) • Population – 175,000 (2001 Census)
SAMOA WATER AUTHORITY • Corporatized 1994 • Move towards financial independence • Water Supply – 82% popn (17000 customers) • Treatment Plants – 3 • Raw Water systems • Boreholes • O & M Expenditure • $7 m/yr • Community schemes – approx 15% • No water supply – less than 5% popn. • ISP, EU projects
Scope of Case Study • Apia Urban Area • 1995 – limited metering • 1999 – A.W.S.C.P • Full scale metering program • About 4000 meters
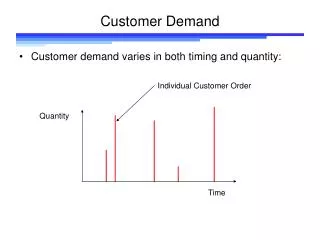
Background - APIA URBAN AREA • Pop = approx 38,000 • Incomes = $2400 - $80,000 / annum • Central Business District • Excessive demands • Approx – 900 l/c/d (pre-metering 1999) • Water is free, from God, plentiful • Treated and Raw supply (80% mixed in 1999) • Low pressures, demand exceed production treated • Inaccurate maps
DEMAND MANAGEMENT INITIATIVES • No Formal Demand Management Strategy • Metering and Tariff • Treated supply • Progressive $0.12/m3/d - $1.40/m3/d • Leak Detection • Improving Operation & Maintenance
HOW TO METER APIA ? • Isolate areas to be supplied by treated water • Network modifications – valves, re-route pipes • Meter target area • Extend area – when demand reduction allows • Continue until 100% coverage
METERING PROCESS • Step 1 – Isolate Target Area • Treated and sufficient quantity • Step 2 – Awareness & Acceptance • Media campaign • Village groups consultations • Matai consultation (advisory committee) • Disconnect supply • Step 3 – Installation & Billing • Pre-fabrication at workshop • 3 month grace period • Monthly reading • Counselling & assistance
RESULTS & LESSONS LEARNT • Reduction of Demand • Approx 350l/c/d (2002) • Extend Treated water coverage to 80% • Community Awareness of metering • Consultation using traditional hierarchy (matai) • Above-ground meters
FURTHER ACTIONS • Demand Management Strategy • UFW – theft, illegal connections • System Performance – data • Asset Mgt Strategy • O&M improvements • Leak Detection • Disaster (Drought) mgt • Mapping • New Tariff Structure (proposal) • O&M simple cost recovery • 2 bands rather than logarithmic • 5 year + review • ‘free’ portion – 0.5m3/d • Billing Process • Time and labour intensive • Review of Progress • Customer survey • Metering records - consumption • Extension of treated water supply
CHALLENGES IN DEMAND MANAGEMENT FOR SWA • Influx of 3500 initially (total 6000) meters – EURWSP • Doubling of system assets – EURWSP • New Computerised Asset Management System • Successful implementation of new Tariff Structure (awaiting Cabinet approval) and impact on consumption • Translating results of progress review into actions for improvement • Limited local Technical expertise (only 5 engineers in SWA)