Download
1 / 13
130 likes | 472 Views
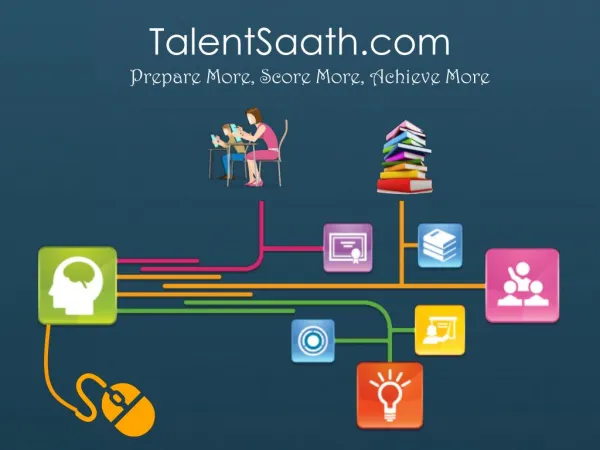
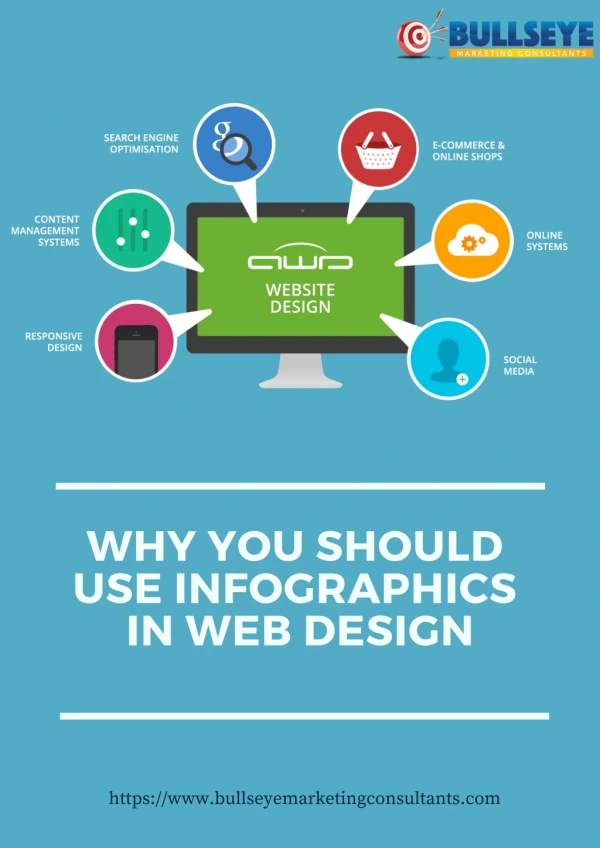
Why You Should Use Infographics. Cognition + Emotion. =. Augmented Intelligence. How to Create Infographics Like a Boss. So what your saying is…. There isn’t one way to create these– no formal process to follow. The creation process is messy and often evolving

E N D
Cognition + Emotion = Augmented Intelligence
So what your saying is… There isn’t one way to create these– no formal process to follow. The creation process is messy and often evolving Review, copy and discuss good examples Learn about the rules and when to break them Don’t be afraid of the shitty first draft
Some resources that can help you are… • Steps and tips: • http://bjclearn.org/TeachingMethods/wp-content/uploads/2014/04/whatMakesAGreatInfographic4.pdf • http://bjclearn.org/TeachingMethods/wp-content/uploads/2014/04/Finishing_Infographics.pptx • http://www.elearningguild.com/assets/files/45/ls14_709_woods.pdf • http://www.bitrebels.com/design/8-types-of-infographics-use-when/ • http://www.datavizcatalogue.com/ • Free tools • http://infogr.am/ • http://piktochart.com/ • Examples • http://dailyinfographic.com/ • http://www.coolinfographics.com/
Some tips that may help you… • Think of these as a normal paper or article– don’t stress about the graphics and layouts upfront. • Only use the data that strongly relates to your main story. • Know your audience • Reference/Site your data • Do more than infographics
Infographics are just well- designed infodumps
Ways to do more… Make content interactive Let users see into the data
Wrap- Up http://bjclearn.org/TeachingMethods/ http://rockidscience.com http://elearningindustry.com/doing-more-than-infographics