Download
1 / 21

E N D
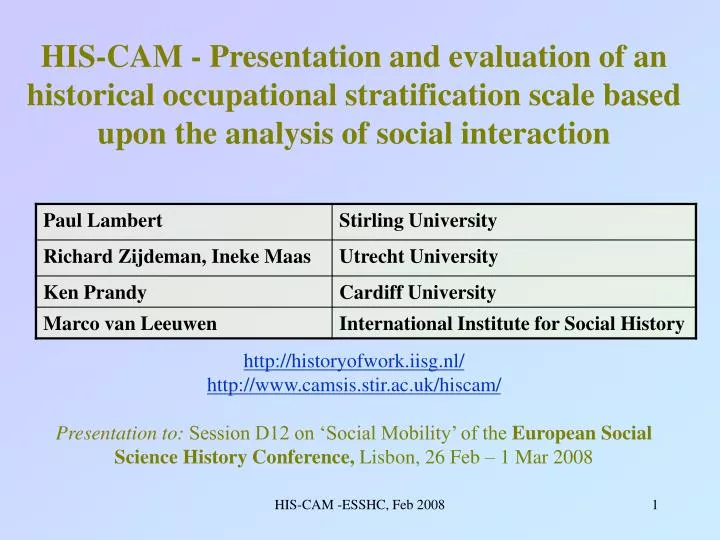
HIS-CAM - Presentation and evaluation of an historical occupational stratification scale based upon the analysis of social interactionhttp://historyofwork.iisg.nl/http://www.camsis.stir.ac.uk/hiscam/Presentation to: Session D12 on ‘Social Mobility’ of the European Social Science History Conference, Lisbon, 26 Feb – 1 Mar 2008 HIS-CAM -ESSHC, Feb 2008
Social interaction and social stratification • Long observed link between social interaction patterns and social stratification • [Weber; Bourdieu 1984; Bottero 2003] • [Blau and Duncan 1967; McPherson et al 1999; Kalmijn 1998] • Analysis of social interaction patterns can be used to tell us about structures of social stratification • ‘Cambridge scale’ and CAMSIS: [Stewart et al 1980; Prandy 1990; Prandy and Lambert 2003] • [Lauman 1966; Bakker 1993; Chan and Goldthorpe 2004] HIS-CAM -ESSHC, Feb 2008
CAMSIS, www.camsis.stir.ac.uk Lays out a methodology for analysing social interaction for the purpose of social stratification research • Analyse pairs of occupations linked by a social interaction (marriage; friendship; inter- and intra-generational connections) • Use correspondence analysis (SPSS; Stata) or RC-II association models (Stata; lEM) on pairs of occupations • Tradition of ‘specificity’: makes an empirical calculation within a ‘context’ (country; time period) HIS-CAM -ESSHC, Feb 2008
Derived scores predict frequency of interactions (#cases per cell) • The scales describe one or more dimensions of a structure of social interaction… • …this turns out to also represent a structure of social stratification… • …resulting in scale scores which measure an occupation’s relative position within the structure of stratification.
Occupations and social structure in history (1800-1938) • ‘Starting from the occupational titles themselves’ [HISCO – van Leeuwen, Maas & Miles, 2002, p28] • ‘The historical process …. does of course influence the relative social position of the different groups’ [Thomsen, 2008 – today!] • Relatively easy to access data on occupations linked through social interactions: inter-generational occupational links from marriage registers etc HIS-CAM -ESSHC, Feb 2008
HIS-CAM scales can offer • Summary measure of occupational positions • Differentiates finer occupational details • Typically 300+ occupational units assigned different scores • Emphasises a hierarchical structure of inequality • Measures relative advantages typically associated with incumbents of an occupational position • Explorative device for understanding occupations • Measure multiple relative structures of stratification between countries, time periods, gender based groups..? HIS-CAM -ESSHC, Feb 2008
HIS-CAM in summary • Version 0.1(www.camsis.stir.ac.uk/hiscam/, May 2006) • Netherlands, Germany, France, Sweden, UK, Canada • Occupational coding to HISCO standardised across countries • One cross-national scale; 6 national scales (specific), for 1800-1938; scales for ‘early’ and ‘late’ periods (c1890) • Version 0.2(February 2008) • Experimental review producing a great many alterative scales • (combinations of countries*time periods*gender groups) • Improved micro-data on 6 core countries (extended coding quality review; increased volume of cases); new data US & Belgium • Occupational coding at localised levels • Automatic scale derivations • Version 1.0(Spring 2008) • 11 scales for public release • ..See conclusions.. HIS-CAM -ESSHC, Feb 2008
HIS-CAM scales prove to have very similar properties to contemporary CAMSIS scales • Clearly reflect an order of stratification advantage / disadvantage in occupations • Jobs with educational requirements tend to be highest ranked (Univ. professors) • Low skilled labouring jobs tend to be lowest ranked • Correlate around 0.7 with prestige scales, class schemes • Some plausible differences between (some) different specific scales • Agricultural jobs show most variation in relative positions between countries • Service sector jobs change positions over period HIS-CAM -ESSHC, Feb 2008
Version 0.1: HIS-CAM -ESSHC, Feb 2008
End point at v0.1 • Combining sparse HISCO unit groups in the same way across countries is problematic • Universality or specificity • (how many scales should there be?) • Statistical support for maximum specificity • But broad correlations between schemes HIS-CAM -ESSHC, Feb 2008
Version 0.2: Permutations of occupations HIS-CAM -ESSHC, Feb 2008
Approaching maximum specificity • Combination of small occupational groups on each of the 825 samples is substantially different • (in v0.1, this was ignored by using common coding in a nested model framework) • Ideally, national experts in occupational coding and statistical modelling would review coding and categorisations and optimise statistical models [=>relatively few contemporary CAMSIS scales…] HIS-CAM -ESSHC, Feb 2008
v0.2 strategies • Automated recoding of sparse occupations • (to popular or generic subgroup codes) • Standard model selection criteria • (2 dimensional correspondence analysis and limited additional treatments for over-influential cases) • The whole process can be automated using Stata (correspondence analysis) • 825 automatically derived scales now exist • What on earth to do with them..? HIS-CAM -ESSHC, Feb 2008
Example 1: A well-identified automatic scale HIS-CAM -ESSHC, Feb 2008
Example 2: A well-identified automatic scale HIS-CAM -ESSHC, Feb 2008
Practical and empirical problems with automatic scales: HIS-CAM -ESSHC, Feb 2008
Summary on v0.2 • V0.2 helps us to evaluate the scale-construction procedure • Some v0.2 examples show persuasive evidence of specificity (not previously visible in v0.1) But some problems.. • Automation produces more results than can easily be reviewed • Automation produces many poor results (?50%) • Model estimates not subject to expert review (detecting and highlighting appropriate dimensions) • Automated recoding still misses country differences • Users of scales probably don’t want 825 alternatives..! HIS-CAM -ESSHC, Feb 2008
Version 1.0 • There is statistical and substantive evidence for both specificity and for universality • There are practical limitations to too much specificity • Persuaded by a strategy of ‘realistic complexity’ Version 1.0 • Publication of a small number of specific scales (based on key patterns from v0.1 and v0.2) • 1 cross-national • 8 national specific • 1 cross-national pre-1890; 1 cross-national post 1891 • Options for further analyses (using national expertise) HIS-CAM -ESSHC, Feb 2008
Appendix: how to use HIS-CAM • Selected scales at www.camsis.stir.ac.uk/hiscam • Released versions can also be accessed at www.geode.stir.ac.uk • Data manipulation tasks: • Match files in SPSS, Stata or plain text • Recode macros in SPSS, Stata • Use as a measure • Interpretation: the relative position typically held by incumbents of the occupational group within the structure of social stratification […for context – year, country etc] • Social mobility analysis: no, it’s not circular • Use as information about occupations • New data on relative positions of occupational units HIS-CAM -ESSHC, Feb 2008