Download
1 / 11
250 likes | 616 Views
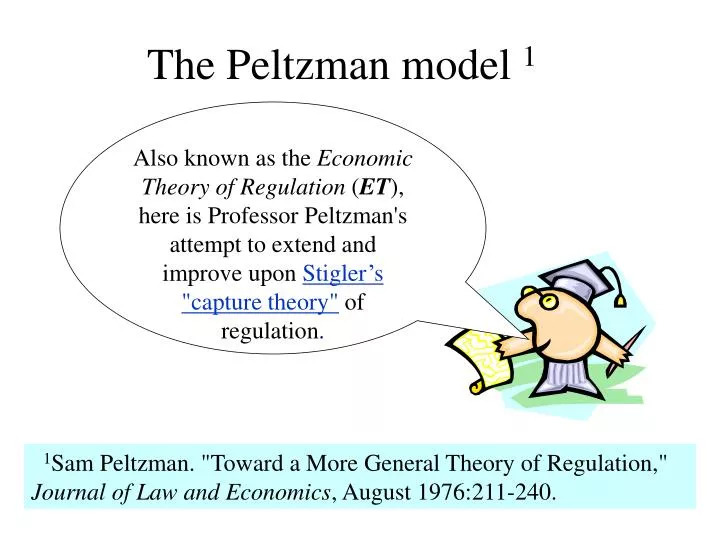
The Peltzman model 1. Also known as the Economic Theory of Regulation ( ET ), here is Professor Peltzman's attempt to extend and improve upon Stigler’s "capture theory" of regulation.

E N D
The Peltzman model 1 Also known as the Economic Theory of Regulation (ET), here is Professor Peltzman's attempt to extend and improve upon Stigler’s "capture theory" of regulation. 1Sam Peltzman. "Toward a More General Theory of Regulation," Journal of Law and Economics, August 1976:211-240.
Suppositions of the ET • Various groups (e.g., consumers and regulated firms) compete against each other in the political arena to increase their income and wealth, or to achieve other objectives (such as environmental cleanliness). That is, groups vie to shape regulatory initiatives in a way that will serve their own (sometimes narrowly-defined) interests. • Agents are rational in choosing actions that are utility-maximizing.
The basic hypothesis of the ET Regulation is one means by which state power can be exercised to the benefit of specific groups. Regulation is supplied by utility-maximizing politicians and regulators in response to the demand for regulation by interest groups.
Key assumption Those who control regulatory policy do so to maximize political support. Political support comes in the form of votes or campaign contributions.
Optimal regulatory policy • Let the political support function (M) be described by:M = M(R, ) • Where R is rates established for the regulated service (e.g., electricity) by the regulatory authority (e.g., the New York Public Service Commission) and is the allowed level of profit earned by the regulated firm (e.g., New York Edison). Notice that M is inversely related to R, ceteris paribus, and directly related to , ceteris paribus. That is: and
In other words, regulators or politicians prefer to set low rates, other things being equal, since this strategy will garner political support from the customers of regulated firms. On the other hand, allowing the regulated firm to earn high profits (which would mean higher rates, by the way) puts the regulated in good stead with business and social elites that own/control regulated firms.
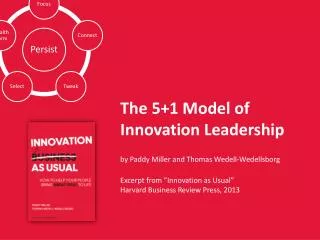
Conflicting agendas • Thus we have two interest groups with conflicting agendas. Consumers want low rates; whereas regulated firms want high profits. • The politicians/regulators face a trade-off. If they allow higher profits, they gain political support from firms they regulate but lose support from consumers. The reverse is also true. This tradeoff is illustrated by the iso-political support function. • The iso-political support function illustrates all combinations of R’s and ’s that yield equal political support.
Iso-political support functions Hear audio explanation (wav) M3 M2 M1 Profits of regulated firms Note:M3is preferred to M2, which is preferred to M1 0 R2 Utility Rates per KWH R1
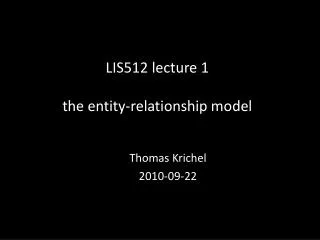
Optimal regulatory policy Hear audio explanation (wav) M3 M2 M1 Profit function Profits of regulated firms 0 RC R* Utility Rates per KWH RM
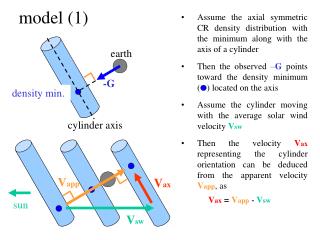
Extreme outcomes Regulators “captured” by consumers Stigler solution—Regulators “captured” by regulated industry MC MF Profits of regulated firms Profit function 0 RC Utility Rates per KWH RM
We never see these extreme cases in practice. Rates established always fall between RC and RM. In states with powerful consumer advocacy groups (e.g., Wisconsin, Massachusetts), rates generally are closer to RC than in states with weak consumer advocacy (e.g., Mississippi) Back to Lesson 10