Download

1 / 40
400 likes | 492 Views
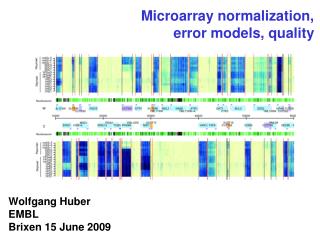
Microarray quality metrics Rafael Irizarry Wolfgang Huber. What is quality?. What is quality?. Conformance to specifications Phil Crosby, quality control manager of the Pershing missile program. Problem: the specifications may not be what the customer wants.

E N D
What is quality? Conformance to specifications Phil Crosby, quality control manager of the Pershing missile program Problem: the specifications may not be what the customer wants. Crosby treated this as a separate problem. Fitness for use Joseph M. Juran, quality management guru. Fitness is defined by the customer. Value to some person Gerald M. Weinberg, author of The psychology of computer programming source: wikipedia
What is quality? Two-dimensional model of quality: must-be quality ~ fitness for use attractive quality: what the customer would love, but has not yet thought about Noriaki Kano and others Costs go down and productivity goes up W. Edwards Deming, American statistician who worked in Japan in 1950s The loss a product imposes on society after it is shipped Genichi Taguchi, Japanese engineer and statistician source: wikipedia
What is quality? Quality: A subjective term for which each person has his or her own definition. In technical usage, quality can have two meanings: 1. the characteristics of a product or service that bear on its ability to satisfy stated or implied needs. 2. a product or service free of deficiencies. The American Society for Quality (ASQ) source: www.asq.org
Precision vs accuracy biasaccuracy precision variance
Basic dogma of data analysis: Can always increase sensitivity on the cost of specificity, or vice versa, the art is to find the optimal trade-off. X X X X X X X X X
Low variance, strong bias, Accurate, but not precise Low bias, high variance Precise, but not accurate
Two-dimensional quality space and there can be additional dimensions: price, availability, ... Accuracy Precision or Reproducibility
quality of Affymetrix preprocessing algorithms (affycomp I, 28 Sep 2003) good bad
Systematic Stochastic o similar effect on many measurements o corrections can be estimated from data o too random to be ex-plicitely accounted for o “noise” Adjustment (background, scale) Error model Systematic vs Stochastic Errors amount of RNA efficiencies of -RNA extraction -reverse transcription -labeling -photodetection RT efficiency RNA quality spotting efficiency, spot size cross-/unspecific hybridization stray signal
Levels of quality: - data point from one feature- all data from a feature - one array hybridization - one RNA sample - a batch of arrays - whole experiment
Density representation of the scatterplot (76,000 probes)
Scatterplot: point densities can be deceiving ...the same data...
PCR plates Scatterplot, colored by PCR-plate Two RZPD Unigene II cDNA nylon membranes
print-tip effects F(q) q (log-ratio)
spotting pin quality decline after delivery of 5x10⁵ spots after delivery of 3x10⁵ spots H. Sueltmann DKFZ/MGA
spatial effects R Rb R-Rbcolor scale by rank another array: print-tip color scale ~ log(G) color scale ~ rank(G) spotted cDNA arrays, Stanford-type
Probe specific normali-zation S/N 3.22 3.47 4.04 remove ‘dead’ probes 4.58 4.36
Batches: array to array differences dij = madk(hik -hjk) arrays i=1…63; roughly sorted by time
Empirical array quality weights in the analysis of microarray data Matthew Ritchie (EMBL-EBI, UK) & Gordon Smyth (WEHI, Australia) BMC Bioinformatics, 2006, 7:261
... ... ... ... ... ... ... Array quality metrics Consider a small experiment with replication. Our aim is to find differentially expressed genes. BUT arrays vary in quality - what can we do about it? 1. Identify unreliable arrays using diagnostic plots, and remove from further analysis (typical) 2. Array weights - measure reproducibility from replicate arrays and down-weight expression values from unreliable arrays (graduated) 3.Do nothing probes (genes) arrays
Modelling variability Linear models for microarrays: Expression measures ygi for genes g on arrays i Expectation value Usual approach: gene-specific variance, same for all arrays, fitted from data Here: simple multiplicative model, gene- and array specific variance fitted from data NB - Prior known weights for each data point can also be incorporated
arrays genes
Using the array quality weights in the analysis • Use estimate of to obtain array weights which are used in re-fits of the mean model to obtain more precise estimates of • Test for significance using t-statistics
Results from simulations 1. 2. 3. 1. 2. 3. 3 2 1 3 2 1
Validation using control data Series of spike-in controls added in known relative amounts prior to labelling U10 U03 DR D03 D10
Array weights for spike-in controls w91 = 3.68 w19 = 0.11
Array weights improve our ability to detect known differential expression
Array weights improve our ability to detect differential expression • FDR controlled to be less than 0.05 in each analysis • 413 (63%) are ranked as differentially expressed in the 3mM vs 0mM condition
Summary • Using array weights allows data quality to be treated in a graduated way • Automatic weights derived from the data – quick and easy assessment of quality • Improves our ability to detect real differential expression • Available in the R software package limma from http://www.bioconductor.org • For further details on the method, see Ritchie et al, BMC Bioinformatics, 2006, 7: 261
To Do The quality features that Illumina and Nimblegen propose??? Scatterplot matrix ('pairs') Density vs ecdf Facilities in bioc affyPLM arrayQuality arrayMagic arrayQCPlot limma