Download
1 / 25
260 likes | 421 Views
Differences Between Group Means. (Click icon for audio). Differences between Groups when Comparing Means. Interval or ratio scaled variables t-test When groups are small When population standard deviation is unknown z-test When groups are large.

E N D
Differences Between Group Means (Click icon for audio) Dr. Michael R. Hyman, NMSU
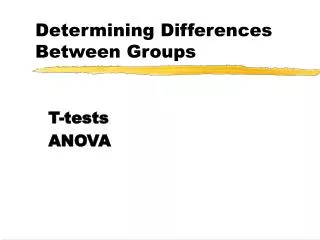
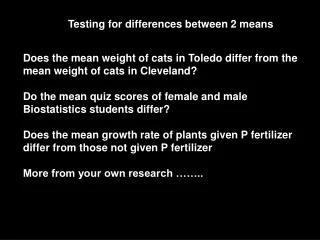
Differences between Groups when Comparing Means • Interval or ratio scaled variables • t-test • When groups are small • When population standard deviation is unknown • z-test • When groups are large
X1 = mean for Group 1 X2 = mean for Group 2 SX1-X2 = the pooled or combined standard error of difference between means t-Test for Difference of Means
Pooled Estimate of the Standard Errort-test for the Difference of Means S12 = the variance of Group 1 S22 = the variance of Group 2 n1 = the sample size of Group 1 n2 = the sample size of Group 2
Comparing Two Groups when Comparing Proportions • Percentage Comparisons • Sample Proportion - P • Population Proportion -
Differences between Two Groups when Comparing Proportions The hypothesis is: Ho: P1 = P2 may be restated as: Ho: P1 - P2 = 0
Z-Test for Differences of Proportions p1 = sample portion of successes in Group 1 p2 = sample portion of successes in Group 2 (p1 - p1)= hypothesized population proportion 1 minus hypothesized population proportion 1 minus Sp1-p2 = pooled estimate of the standard errors of difference of proportions
Z-Test for Differences of Proportions: Standard Deviation p= pooled estimate of proportion of success in a sample of both groups p= (1- p) or a pooled estimate of proportion of failures in a sample of both groups n1 = sample size for group 1 n2 = sample size for group 2
Hypothesis Test of a Proportion p is the population proportion p is the sample proportion p is estimated with p
Hypothesis Test of a Proportion p = H : . 5 0 p ¹ H : . 5 1
= n 1 , 200 = p . 20 pq = S p n (. 2 )(. 8 ) = S p 1200 . 16 = S p 1200 = S . 000133 p = S . 0115 p Hypothesis Test of a Proportion: Another Example
The Z value exceeds 1.96, so the null hypothesis should be rejected at the .05 level. it is significant t beyond the .001 Hypothesis Test of a Proportion: Another Example - p p = Z S p - . 20 . 15 = Z . 0115 . 05 = Z . 0115 = Z 4 . 348 Indeed