Download
1 / 17
170 likes | 511 Views
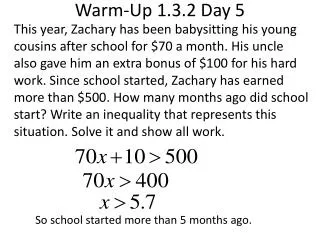
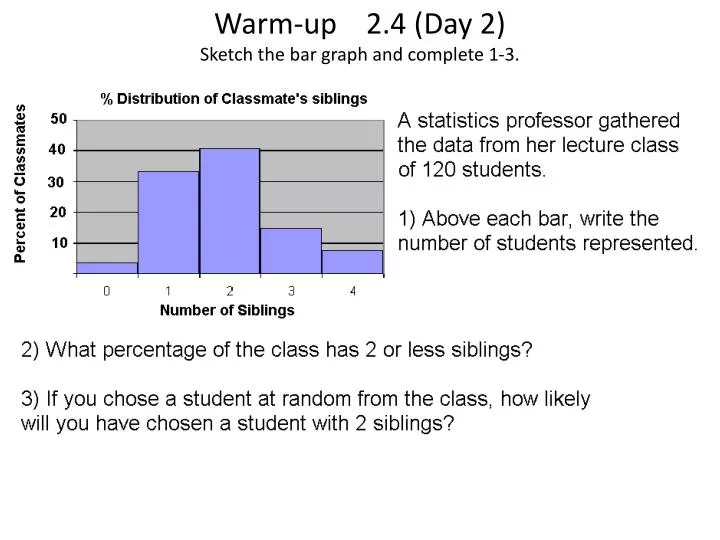
Warm-up 2.4 (Day 2) Sketch the bar graph and complete 1-3. 2.4 H.W. Answers #53 and 54. #53 a. The median, where 50% of the data lies, is below $0.25. b. Q1 (The 25% mark) is around $0.10. Q3 (The 75% mark) is around $0.70. c. The data is definitely skewed to the right. The

E N D
2.4 H.W. Answers #53 and 54 #53 a. The median, where 50% of the data lies, is below $0.25. b. Q1 (The 25% mark) is around $0.10. Q3 (The 75% mark) is around $0.70. c. The data is definitely skewed to the right. The majority of the students have less than a quarter and then the percentiles go up very slowly until it finally reaches $2.75. d. Since the data is skewed it can not be a normal distribution.
Recentered or Rescaled Data? • Converting data from lbs. to kgs.. • Converting data from U.S. dollars to Mexican pesos. (Suppose $1 = 9.4 Mexican pesos) 3. Adding a constant c to each value of the data: x1, x2, x3, x4, and x5.
Complete the worksheet comparing weekly payrolls of Mooseburgers and McTofu • Think about why the mean is not always a good description of the center of data? • You will be given 15 minutes to complete the sheet and then we will be going over the answers. • I will check the completion once the 15 minutes are up for a participation grade. • Keep this sheet with your notes that you took today
2.5 Normal Distribution Where do you see it? Standardized test results, probability, certain data collection from a large population.
Practice Reading the Bell Curve 1) What % of the data is below +1 ? 2) What % of the data is located between the -2 and -1 ?
Solving Problems with Normal DistributionFor Normal Distribution Problem, always draw the bell curve and label the values of mean and standard deviations.
H.W. Assignment • MooseburgerMcTofu worksheet • Chance for a H.W. Pass ( worth 20 pts = 1 day of a h.w. check) Download onto your TI-83, TI-83 Plus or TI-84 the program Ctlghelp. • The first 3 from each block that downloads the program AND can tell me how to transfer the program to another calculator gets a H.W. pass. **** See me tomorrow morning before 7:55, during 2nd Block (get permission…I might be in the vault making copies), or during 7th block. Just be one of the first 3!