Download
1 / 39
1k likes | 2.67k Views
Basics of Clinical Flow Cytometry. Jessica Hughes, QCYM (ASCP). What is flow cytometry?. The measurement of cells in a flow stream, which delivers the cells in single file past a point of measurement. Basics of a flow cytometer.

E N D
Basics of Clinical Flow Cytometry Jessica Hughes, QCYM (ASCP)
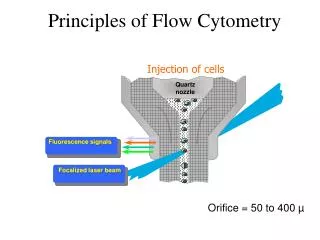
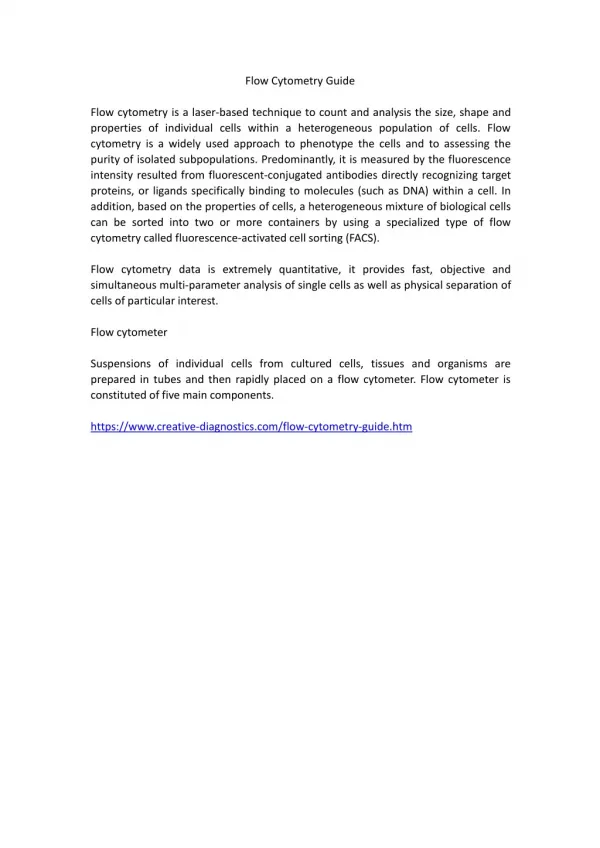
What is flow cytometry? • The measurement of cells in a flow stream, which delivers the cells in single file past a point of measurement
Basics of a flow cytometer • Fluidics – Cells in suspension move in single file through a flow chamber • Optics – Cells pass through a laser beam, scatter light, and emit fluorescence • Electronics – Light scatter and fluorescence are converted to digital values and stored on a computer
Forward scatter & side scatter • Forward scatter measures a cell’s size • The larger the cell, the greater the forward scatter • Side scatter measures a cell’s granularity • The more granular a cell, the greater the side scatter
Forward vs. side scatter plot Can you figure out the different cell populations? More granular cells Larger cells
Forward vs. Side Scatter Plot More granular cells Larger cells
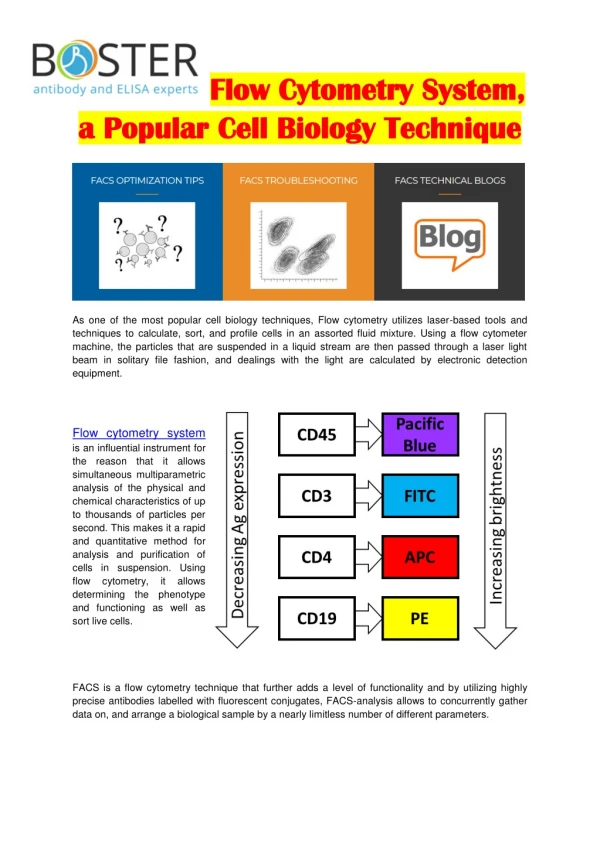
Fluorescence and Fluorochromes • Antibodies are labeled with different fluorochromes • The antibody will bind to an antigen on the cell’s surface, if present • A fluorescent signal is generated if that specific marker is present on the cell’s surface
2 Parameter Dot Plot PerCP positive population (pink) PerCP and PE positive population (yellow) PerCP and PE negative population (green) PE positive population (blue)
Some flow cytometry clinical applications • Lymphocyte subset analysis (T cells, B cells, NK cells) • Immune disorders • Leukemia/lymphoma immunophenotyping • Paroxysmal Nocturnal Hemoglobinuria • Reticulocyte analysis
Lymphocyte subset analysis • T cells • Originate in bone marrow • Mature in thymus • Responsible for immunological defense mechanism known as cell-mediated immunity • CD3 – pan T-cell marker • CD4 – helper T-cell marker • CD8 – cytotoxic T-cell marker
Lymphocyte subset analysis • B-cells • Originate in the bone marrow • Major role is to secrete immunoglobulins • Responsible for humoral immunity defense • CD19, CD20 - B-cell markers
Lymphocyte subset analysis • Natural Killer cells • Cytotoxic lymphocytes • Cells kill by releasing small cytoplasmic granules • CD16, CD56
Lymphocyte subset analysis T cells + B cells + NK cells = 100% of lymphocytes
T cells + B cells + NK cells = 100% of lymphs 69 + 15 + 13 = 97% (close enough)
Leukemia/Lymphoma Immunophenotyping Normal peripheral blood CD45 vs. SS plot (common gating technique) CD45 – common leukocyte antigen RBCs are negative for CD45, therefore can be excluded from analysis.
Leukemia/Lymphoma Immunophenotyping Normal bone marrow Normal bone marrow shows immature and mature cells
Analysis and gating techniques A population can be gated, then displayed on its own in a separate plot. Here, we are looking at the maturation pattern of neutrophils.
Antibody combinations / panels • Monoclonal antibodies (CD markers) are generally grouped in lineage specific groups • Panels are lab-specific • Example: leukemia/lymphoma panels • Shotgun approach – uses a large number of antibodies and covers everything. Diagnosis can be made without having to go back and stain additional tubes. This can be more expensive. • Screening approach – uses a minimal set of antibodies. More tubes will be stained with additional antibodies if abnormalities are found. This can be more time-consuming.
Workflow in a flow cytometry lab • Sample processing • Acquiring sample on flow cytometer • Data analysis • Interpretation given by Hematopathologist • Result entry into patient’s record
Flow case study #1 70 year old patient with a history of myelodysplastic syndrome and complex cytogenetic abnormalities.
Peripheral Blood Lab findings WBC 1.27 K/uL 32% blasts
Morphology – case study #1 Blast in peripheral blood smear
Morphology – case study #1 Blasts in the marrow CD34 staining (red) in the marrow
Flow case study #1 - Diagnosis Hypercellular bone marrow with multilineage dysplasia, increased blasts and marked fibrosis, consistent with myelodysplastic syndrome with fibrosis transforming to acute myeloid leukemia. Other notes: Blasts approach 20% in the marrow and exceed 20% in the peripheral blood, consistent with transformation to acute myeloid leukemia. Additionally, this case shows a unique pattern of segmental/focal severe fibrosis of the marrow. Moderate-severe bone marrow fibrosis has been reported in up to 10% of patients with MDS and is usually associated with multilineage dysplasia, profound cytopenias, and complex cytogenetic abnormalities.
Flow case study #2 6 year old with immunodeficiency, EBV viremia, and unknown genetic defect
Flow case study #2 B-cell maturation:
Flow case study #2 Gated on CD3+ cells (T-cells)
Flow case study #2 - Diagnosis Normocellular marrow with progressive trilineage hematopoiesis, B-cell lymphocytosis and decreased CD4-positive T-cells. No evidence of lymphoma. Rare EBV-positive cells identified. Other Notes: Flow cytometric analysis of the bone marrow aspirate reveals increased precursor B-cells / B-cells that are positive for CD20, CD19, CD10 and negative for CD34. T-cell analysis reveals inverted CD4/CD8 T-cell ratio and reduced CD4 positive T-cells.
Flow case study #3 TRAP staining - brown
Flow case study #3 - Diagnosis Variably hypocellular marrow involved by residual Hairy cell leukemia, compromising approximately 70% of marrow cellularity. Other notes: Flow cytometric analysis on marrow aspirate detected approximately 6% of the lymphoid cells (95% of B-cells) that were monoclonal B-cells expressing bright CD11c, CD19, bright CD20, bright CD22, CD103, and surface lambda light chain consistent with residual Hairy cell leukemia.