Download
1 / 33
380 likes | 598 Views
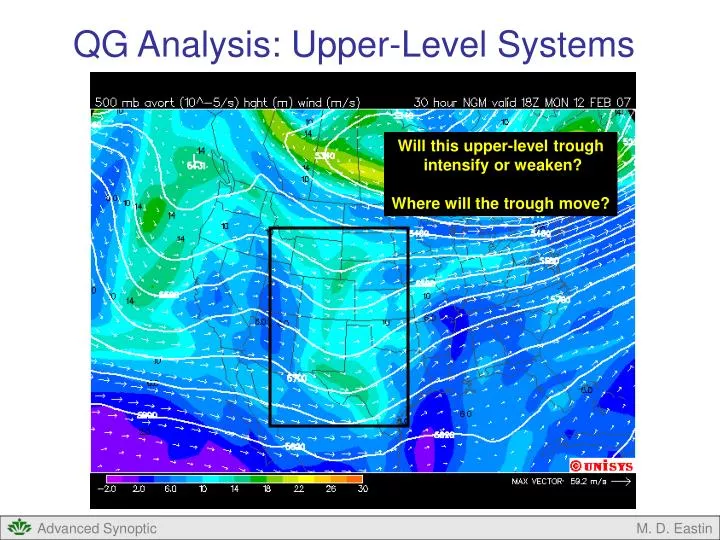
QG Analysis: Upper-Level Systems. Will this upper-level trough intensify or weaken? Where will the trough move?. QG Analysis. QG Theory Basic Idea Approximations and Validity QG Equations / Reference QG Analysis Basic Idea Estimating Vertical Motion QG Omega Equation: Basic Form

E N D
QG Analysis: Upper-Level Systems Will this upper-level trough intensify or weaken? Where will the trough move? M. D. Eastin
QG Analysis • QG Theory • Basic Idea • Approximations and Validity • QG Equations / Reference • QG Analysis • Basic Idea • Estimating Vertical Motion • QG Omega Equation: Basic Form • QG Omega Equation: Relation to Jet Streaks • QG Omega Equation: Q-vector Form • Estimating System Evolution • QG Height Tendency Equation • Diabatic and Orographic Processes • Evolution of Low-level Systems • Evolution of Upper-level Systems M. D. Eastin
QG Analysis: Upper-Level Systems • Goal: We want to use QG analysis to diagnose and “predict” the formation, • evolution, and motion of upper-level troughs and ridges • Which QG Equation? • We could use the QG omega equation • Would require additional steps to convert vertical motions to structure change • No prediction → diagnostic equation → we would still need more information! • We can apply the QG height-tendency equation • Ideal for evaluating structural change above the surface • Prediction of future structure → exactly what we want! Vertical Motion Differential Thermal Advection Vorticity Advection + Diabatic Forcing + Topographic Forcing M. D. Eastin
QG Analysis: Upper-Level Systems • Evaluate Total Forcing: • You must consider the combined effects from each forcing type in order to infer the • expected totalgeopotential height change • Sometimes one forcing will “precondition” the atmosphere for another forcing • and the combination will enhance amplification of the trough / ridge • Other times, forcing types will oppose each other, inhibiting (or limiting) any • amplification of the trough / ridge • Note: Nature continuously provides us with a wide spectrum of favorable and unfavorable • combinations…see the case study and your homework Vertical Motion Differential Thermal Advection Vorticity Advection + Diabatic Forcing + Topographic Forcing M. D. Eastin
QG Analysis: Upper-Level Systems • Evaluate Total Forcing: • Forcing for height falls: → PVA • (trough amplification) → Increase in WAA with height • → Increase in diabatic heating with height • → Increase in downslope flow with height • Forcing for height rises: → NVA • (ridge amplification) → Increase in CAA with height • → Increase in diabatic coolingwith height • → Increase in upslope flow with height Vertical Motion Differential Thermal Advection Vorticity Advection + Diabatic Forcing + Topographic Forcing M. D. Eastin
QG Analysis: Upper-Level Systems • Important Aspects of Vorticity Advection: • Vorticity maximum at trough axis: • PVA and height falls downstream • NVA and height rises upstream • No height changes occur at the • trough axis • Trough amplitude does not change • Trough simply moves downstream • (to the east) M. D. Eastin
QG Analysis: Upper-Level Systems • Important Aspects of Vorticity Advection: • Vorticity maximum upstream of trough axis: • PVA (or CVA) at the trough axis • Height falls occur at the trough axis • Trough amplitude increases • Trough “digs” equatorward • Vorticity maximum downstream of trough axis: • NVA (or AVA) at the trough axis • Height rises occur at the trough axis • Trough amplitude decreases • Trough ”lifts” poleward Digs Lifts AVA M. D. Eastin
QG Analysis: Upper-Level Systems Important Aspects of Vorticity Advection:Digging Trough 500mb Wind Speeds 500mb Wind Speeds t = 0 hr t = 24 hr 500mb Absolute Vorticity 500mb Absolute Vorticity t = 0 hr t = 24 hr M. D. Eastin
QG Analysis: Upper-Level Systems Important Aspects of Vorticity Advection:Lifting Trough 500mb Wind Speeds 500mb Wind Speeds t = 0 hr t = 24 hr 500mb Absolute Vorticity 500mb Absolute Vorticity t = 0 hr t = 24 hr M. D. Eastin
Example Case: Formation / Evolution Will this upper-level trough intensify or weaken? M. D. Eastin
Example Case: Formation / Evolution Vorticity Advection: Trough Axis M. D. Eastin
Example Case: Formation / Evolution Vorticity Advection: Trough Axis NVA Expect Height Rises Χ > 0 PVA Expect Height Falls Χ < 0 Weak PVA at trough axis Expect trough to “dig” slightly M. D. Eastin
Example Case: Formation / Evolution Differential Temperature Advection: System has westward tilt with height 500mb Trough Axis M. D. Eastin
Example Case: Formation / Evolution Differential Temperature Advection: System has westward tilt with height 500mb Trough Axis Low-level CAA No temperature advection aloft Expect upper-level Height Falls Χ < 0 Low-level WAA No temperature advection aloft Expect upper-level Height Rises Χ > 0 Expect upper-level trough to “dig” M. D. Eastin
Example Case: Formation / Evolution Diabatic Forcing: 500mb Trough Axis M. D. Eastin
Example Case: Formation / Evolution Diabatic Forcing: 500mb Trough Axis Deep Convection Diabatic Heating Expect upper-level Height Falls Χ < 0 Expect northern portion of upper-level trough to “dig” M. D. Eastin
Example Case: Formation / Evolution Topographic Forcing: 500mb Trough Axis M. D. Eastin
Example Case: Formation / Evolution Topographic Forcing: 500mb Trough Axis Upslope flow (CAA) at low-levels No “topo” flow at 500mb Increase in WAA with height Expect upper-level Height Falls Χ < 0 Expect northern portion of upper-level trough to “dig” M. D. Eastin
Example Case: Formation / Evolution Summary of Forcing Expectations: Initial Time Will this upper-level trough intensify or weaken? Trough Axis Expect upper-level trough to “dig” M. D. Eastin
Example Case: Formation / Evolution “Results” 6-hr Later Initial Trough Axis Trough “dug” (intensified) M. D. Eastin
QG Analysis: Upper-Level System Motion Trough moved east Why? Initial Trough Axis Current Trough Axis M. D. Eastin
QG Analysis: Upper-Level System Motion OR Relative Vorticity Advection Planetary Vorticity Advection Vertical Motion Differential Thermal Advection Vorticity Advection • Whether the relative or planetary vorticity advection dominates the height changes determines if the wave will “progress” or “retrograde” + Diabatic Forcing + Topographic Forcing M. D. Eastin
QG Analysis: Upper-Level System Motion • Scale Analysis for a Synoptic Wave: • Term B • Absolute Vorticity Advection • OR • Relative Vorticity Advection Planetary Vorticity Advection • Assume waves are sinusoidal in structure: U = basic current (zonal flow) • L = wavelength of wave • β = north-south Coriolis gradient • Ratio of relative to planetary vorticity is: M. D. Eastin
QG Analysis: Upper-Level System Motion • Scale Analysis for a Synoptic Wave: • For the Mid-Latitudes: U ~ 10 m s-1 • β ~ 10-11 s-1 m-1 • Whether relative or planetary vorticity advection dominates the height changes • is a function of the wavelength • Short Waves: L < 6000 km • Relative vorticity dominates • Long Waves: L > 6000 km • Planetary vorticity dominates M. D. Eastin
QG Analysis: Upper-Level System Motion • Short Waves: • Most synoptic waves are short waves • with wavelengths less than 6000 km • Relative vorticity maxima (minima) are • often located near trough (ridge) axes • PVA and height falls east of troughs • NVA and height rises east of ridges • Short waves move eastward L < 6000 km L < 6000 km L L Ridge Trough Ridge Trough Note: Several “short waves” can stretch across the entire US at one time Vort Max Vort Min Adapted from Bluestein (1993) M. D. Eastin
QG Analysis: Upper-Level System Motion • Long Waves: • Long waves, with wavelengths greater • than 6000 km, occur during stationary • weather patterns • Planetary vorticity maxima (minima) • are located at ridge (trough) axes • NVA and height rises west of ridges • PVA and height falls west of troughs • Long waves move westward L > 6000 km Trough Ridge Vort Max Note: A single “long wave” would stretch across the entire US and beyond Vort Min Adapted from Bluestein (1993) M. D. Eastin
QG Analysis: Upper-Level System Motion • The “Kicker”: • Long waves are often associated with stationary weather patterns • When a short wave “kicker” approaches a stationary long wave trough, the • wavelength associated with the long wave is effectively decreased • Hence, the long wave becomes a short wave and begins to move eastward • The short wave “kicked out” the long wave, and the stationary weather pattern ends From Bluestein (1993) M. D. Eastin
Example Case: Motion Where will this upper-level trough move? M. D. Eastin
Example Case: Motion Is it a “short wave” or a “long wave”? Initial Time L < 6000 km Short Wave Trough Examine relative vorticity advection Trough Ridge Ridge Trough M. D. Eastin
Example Case: Motion Effects of Vorticity Advection: Initial Time Assume “local” absolute vort max are relative vort maxima Trough Axis NVA Expect Height Rises Χ > 0 PVA Expect Height Falls Χ < 0 Expect trough to move east M. D. Eastin
Example Case: Motion Results: 6-hr Later Initial Trough Axis Current Trough Axis Trough moved east M. D. Eastin
QG Analysis: Upper-Level Systems • Application Tips: Evolution and Motion • ALL relevant forcing terms should be analyzed in each situation!!! • Differential vorticity advection and thermal advection are the dominant terms • in the majority of situations → weight these terms more • Diabatic forcing can be important for system evolution when deep convection • or dry/clear air are present. • Diabatic forcing can be important for system motion when the forcing • is asymmetric about the system center • Topographic forcing is only relevant near large mountain ranges or rapid • elevation changes over a short horizontal distance M. D. Eastin
References Bluestein, H. B, 1993: Synoptic-Dynamic Meteorology in Midlatitudes. Volume I: Principles of Kinematics and Dynamics. Oxford University Press, New York, 431 pp. Bluestein, H. B, 1993: Synoptic-Dynamic Meteorology in Midlatitudes. Volume II: Observations and Theory of Weather Systems. Oxford University Press, New York, 594 pp. Charney, J. G., B. Gilchrist, and F. G. Shuman, 1956: The prediction of general quasi-geostrophic motions. J. Meteor., 13, 489-499. Durran, D. R., and L. W. Snellman, 1987: The diagnosis of synoptic-scale vertical motionin an operational environment. Weather and Forecasting, 2, 17-31. Hoskins, B. J., I. Draghici, and H. C. Davis, 1978: A new look at the ω–equation. Quart. J. Roy. Meteor. Soc., 104, 31-38. Hoskins, B. J., and M. A. Pedder, 1980: The diagnosis of middle latitude synoptic development. Quart. J. Roy. Meteor. Soc., 104, 31-38. Lackmann, G., 2011: Mid-latitude Synoptic Meteorology – Dynamics, Analysis and Forecasting, AMS, 343 pp. Trenberth, K. E., 1978: On the interpretation of the diagnostic quasi-geostrophic omega equation. Mon. Wea. Rev., 106, 131-137. M. D. Eastin