Download
1 / 60
700 likes | 1.1k Views
Merger Integration. Intellectual Capital Collection Generic Proposal. March 2002. Table of contents. Executive Summary Our Understanding of Your Situation A.T. Kearney’s Perspective on Merger Integration Proposed Overall Approach Realizing Integration Synergies Integration Management

E N D
Merger Integration Intellectual Capital Collection Generic Proposal March 2002
Table of contents • Executive Summary • Our Understanding of Your Situation • A.T. Kearney’s Perspective on Merger Integration • Proposed Overall Approach • Realizing Integration Synergies • Integration Management • A.T. Kearney Qualifications
Executive SummaryThis section is tailored to the client situation and summarizes the approach proposed in the document
Our Understanding your SituationThis section is tailored to the client situation and summarizes the key drivers of the merger. It should highlight relevant quantitative and qualitative analysis that demonstrate our insight into the client’s particular challenges and drivers of success for the integration
The best value-builders combine organic growth with mergers and acquisitions Value Growers Follow Conscious, Constant Process To Growth Growth Matrix (CAGR 1988-2000) Simple Growers Value Growers Revenue Growth Under performers Profit Seekers Value Growth Source: A.T. Kearney Monograph on Value-Building Growth 2001
Mergers and acquisitions are key growth drivers 40% of Growth Is From Acquisitions Value Growers Manage Both Well Sources of Growth What really matters in “acquisition for growth” strategies is execution Source: A.T. Kearney Monograph on Value-Building Growth 2001
Few mergers actually create shareholder value Acquirer's Value Growth Following a Merger Average: 2.8% 49.5% 50.5% Top-Performing Mergers 16% 10% 8% 12% 27% 21% 3% 3% Value growth -100% -60% -30% -15% 0% 15% 30% 60% 150% Underperformance compared to industry average Overperformance compared to industry average Top performing mergers create significant shareholder value Source: A.T. Kearney Analysis 2001, SDC database, Global Worldscope
"Usual" Management decisions Strategy & IPO Organisation Infrastructure • Define the scope of combined entity • Confirm each country’s scope of activity for mobiles • Design strategy leveraging on broader global presence • Define financial and operational targets as well as timing of expected benefits • Prepare the IPO • Choose the best organisational model at the European management level • Identify the central/local functions evolution schedule • Define organisational charts and management nomination • Define key decision processes (committees, procedures, …) • Reduce total cost of external purchases through best price evaluation volume concentration, competitive bidding • Share best practices • … Support functions Communication Integration mgnt • Rationalise shared supports ( • Align and select Information Systems for the integration • Align processes and share best practices • Define external communication strategy • Define internal communication strategy • Select communication rules and procedures • Choose media (intranet, documents, speeches…) • Integrate overall planning and milestones • Detail planning by topic and country… • Manage transition phase • Track and execute financial synergies • Manage risks Business Integration issues require “usual” management decisions while four main factors add another level of considerable complexity… Time pressure • All stakeholders expect rapid execution (shareholders, employees, management, regulation committees, government,…) • Decisions need to be made without delay Human component Simultaneity • High number of people potentially involved (operational, functional and executive people) • Risk of cultural mismatch • Scarce resources to bridge between merged companies • Co-existence of strategic, tactic and operational decisions • Strong inter-dependence of the decisions • Short term and strategic decisions may seem incompatible Scope • High number of decisions to be made in all operational and functional areas • Dozens of projects/initiatives and risks to be managed
Only 42% of Companies Outperform Their Peers in Shareholder Value(1) Number of companies 58% 42% Top PerformingMergers Industry average Performance relative to industry average 23% 17% 18% 21% 11% 10% -25% -15% +15% +25% Under performance Outperformance … explaining why only few mergers and acquisitions succeed fully Only 29% of Companies Realize an Increase in Aggregate Profitability 100% = 230 companies Higher Lower Nochange Note: (1) Shareholder returns from buyer divided by shareholder returns (industry average) after the merger Sources : A.T. Kearney analysis, Global PMI Survey, 1998 ; Datastream
Creation of Shareholder Returns Erosion of Shareholder Returns Top performers across most industries can create significant shareholder value Industry Specific Ranges of Value Creation(1) 64.5% 62.5% 49.9% 44.2% 43.3% 40.4% 36.1% 34.2% 31.9% 32.3% 27.5% 26.0% 26.6% 26.6% 25.1% 22.4% 18.0% 17.4% 17.2% 17.4% 16.0% 14.8% 4.0% -6.5% -10.8% -11.0% -9.7% -17.6% -18.0% -17.4% -19.4% -20.3% -20.6% -22.7% -24.1% -25.9% -26.5% -24.9% -26.7% -28.8% -24.1% -31.5% -27.2% -35.0% -35.3% -38.9% -39.6% -46.8% Food Paper Utilities Textiles Tobacco Retailers Financial Electrical Beverages Chemicals Aerospace Recreation Diversified Electronics Automotive Construction Miscellaneous Transportation Metal Producers Printing and Publishing Machinery & Equipment Metal Products Manufacture Drugs, Cosmetics & Health Care Oil, Gas, Coal & Related Services Note: (1) Total shareholder returns percentage over/under performance relative to industry index in the timeframe between 3 months before and 24 months after merger announcement; total shareholder returns defined as the tangible returns investors receive through dividends and stock price appreciations Sources: Datastream; A.T. Kearney Analysis 2001
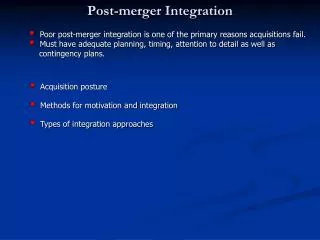
Once the deal is closed, the principal problems relate almost entirely to failures in merger management, rather than to the underlying strategic rationale Problems Identified inMerger Integration Percent of Respondents Under-communication Financial/synergy Expectations Unrealistic/Unclear New Org. Structure With Too Many Compromises “Master Plan” Missing Missing Momentum Missing Top Management Commitment Unclear Strategic Concept Missing Pace of Project IT Issues Addressed Too Late Source: A.T. Kearney’s Global Merger Integration Survey 1998
Sense of Urgency Top-Level Leadership Selected Quickly Clear Synergy Goals Manage Market Expectations Explicit Focus on Customers Open, Timely and Consistent Communications Decentralized Merger Integration Strong Central Integration Office Well-Defined Processes • Create a sense of urgency and reduce uncertainty through clear event milestones, and move quickly • Select top-level leadership quickly and fairly; avoid “two-in-the-box” leadership for integration planning and execution unless absolutely necessary • Set out synergy goals and objectives, to prioritize activities and provide a baseline for performance tracking • Manage market expectations carefully. Set conservative dollar targets with a time frame that accommodates unforeseen circumstances • Keep strong, explicit focus on key customer retention and service with teeth (i.e., measurement and tracking) • Maintain open and timely communications with employees to ensure understanding and retention • Conduct decentralizedmergerIntegration guided forcibly via • Clear guiding principles • Overall framework and tools for integration • Reporting standards • Establish a strong central Integration office and decentralized Integration teams with corporate-wide perspectives on • Results • Project status • Risk • Lead role on internal/external communications • Instill robust, well-defined processes to ensure objective and timely risk and interdependency tracking To manage inherent risks, “critical success factors” can be distilled from successful large-scale mergers to guide value creation Critical Success Factors from Large-Scale Mergers Source: A.T. Kearney Merger Integration
In our experience, the most critical element in achieving targeted benefits is speed Value Capture of Top Performers Over Time Timing of Synergy Realization Is Also Critical 15% 6 85% 4 2 0 Cumulative Value Capture After Two Years Value Capture/Loss ($ MM) -2 -4 -6 -8 -10 1 2 3 4 5 6 7 8 9 10 Year in Which Synergies Are Realized Time Closingthe Deal Year 1 Year 2 Source: Marl L Sirower : The Synergy Trap. Calculated based on a $10MM acquisition premium, representing 50% of market value Source: A.T. Kearney's global PMI survey '98
A.T. Kearney’s Merger Integration Framework A.T. Kearney has a flexible merger integration framework with a comprehensive toolkit to support planning and implementation throughout the merger process to ensure value capture Phase 0 Phase I Phase II Phase III Day One Develop Strategy Establish Structure and Plan Integrated Planning and Initial Rollout Full-Scale Rollout Merger Manage-ment • Establish the integration program • Build integration capability • Create master plan and prioritize • Monitor progress and risk • Merger/Acquisition options • Create/articulate/validate • Markets/customers • Competition • Resources • Sources of value • Understand type of merger • Assess sources of value • Develop organization strategy & design • Validate sources of value • Implement quick hits • Execute the plan • Realign the organization Sources of Value Multiple Tools Exist for All Cells Merger Enablers • Develop IT integration strategy • Design/harmonize HR policies • Develop SOV IT enablers • Implement HR plan • Implement IT integration plan MOU Shareholder Approval Change of Control
This allows merging entities to rapidly capture available sources of value by focusing on operational synergies, as well as seamlessly merging the organizations MI Sources of Value Achieve Growth Synergy and Cost Synergy Targets as Quickly as Possible Merge the Organizations as Seamlessly as Possible • Achieve $ XX million (annual rate) of synergy savings within 12–18 months • Sales • Operations • Procurement • Corporate overlap and duplication • Cost of distribution • Technology/R&D • Others to be identified • Eliminate/minimize sources of risk • Develop and communicate a shared strategic agenda • Define • Organization structures/leadership • Key business processes • Technology platform/architecture • Change integration requirements • Drive top line growth • New value propositions/products • Cross selling/sales pull through • Ensure customer focus/retention • Drive the short-term value • Exceed the market’s expectations • Integrate day-to-day operations • Ensure sustainable change • Position for growth
The program structure supports focused value capture teams working across all SBU/Geographic teams Illustrative • Set overall direction • Make critical decisions • Develop guiding principles Steering Committee Market Facing Teams Value Capture Teams Enabler Teams • Provide integration management leadership and support Integration Office Focused on value capture across the businesses Others BusinessDevelop-ment Team Corporate Center Team Global Operations Team Global Sourcing Team Technology/R&D Team Human Resources Team Information Technology Team SBU A or N. America SBU B or Latin America BU driven integration to set priorities SBU C or Europe SBU D or Asia Pacific
Hypotheses 1 Hypothesis N Hypotheses 1 Hypothesis N L L M M H H H H M M L L By launching the integration effort prior to change of control, significant progress is made in identifying sources of value, while also developing the high-level organization models to capture that value Phase I (“Clean Team”) Establish Structure and Plan Integrated Planning and Initial Rollout Full-Scale Rollout Integration Management Data Repository Comm. Planning Oversight/ Visibility Rm Master Calendar Baseline Dev./Tracking Day/Week/Month 1 Plans Implementation Sources of Value Identification Analysis Opportunities Initial Prioritization Initial Sequencing Data Collection/Analyses Init Q1 Q2 Q3 Q4 • PP 1 • PP 2 • PP 3 • PP 4 Operations/ Asset Consolidation Diagnostic Pack PP1 PP2 PP3 PP4 Data Collection/Analyses Init Q1 Q2 Q3 Q4 • CS 1 • CS 2 • CS 3 • CS 4 Business Unit (e.g., Services) Diagnostic Pack CS1 CS2 CS3 CS4 … … … … High-LevelOrganization IT Requirements/Alignment
During the critical period prior to change of control, the engagement team assumes the role of a “clean team” to enable critical pre-merger integration “Clean Team” Process Role of Clean Team Company A Company B Data Collection Organization assessment Hypotheses development Preliminary planning • Quantify savings generated from identified opportunities from teams of merged companies • Act as a third party conduit for proprietary information of both companies (protection should merger be aborted) • Validate and challenge initial assumptions of opportunities made by merging companies • Highlight best practices in existing companies and external knowledge and recommend ongoing merged operating practices • Determine risk factors in merger for ongoing risk management during implementation Limited Joint Client Team Meetings A.T. Kearney“Clean Team” Pre-Change of Control Merger SynergyHypotheses Post-Change of Control • Accelerate decision making by providing access to comprehensive databases and detailed analysis • Share and validate findings with joint client teams • Finalize initiatives based on validated hypotheses • Develop implementation plans • Assist in launching initiatives and provide continued implementation, risk and financial tracking support Open Joint Client Team Meetings Validated Initiatives The up-front work efforts of the “clean team” enables accelerated launch of implementation activities and value capture
L L M M H H H H M M L L L M H H M L After change of control, the teams quickly finalize — not identify — synergy opportunities and gain consensus Phase II Establish Structure and Plan Integrated Planning and Initial Rollout Full-Scale Rollout Master Plan Detail Timing of Results Investment Requirements Day/Week/Month 1 Execution MD 1 Workplan Overall Prioritization/ Executive Committee Buy-In Initial Prioritization and Sequence Full Team Meetings Master Plan Sequencing Step 1 2 3 4 • Disclose and Validate • Modify and Refine • Finalize Savings Opportunities and Prioritization • Identify Interdependencies Init Q1 Q2 Q3 Q4 PP1 ST3 Workplan Q1 Q2 Q3 Q4 Init MD 1 ST 3 SC 6 Init Q1 Q2 Q3 Q4 PP 4 PP1 SC6 Workplan IT Requirements/Enablers Master Plan Detail Communication Begin Implementation Results Tracking/Risk Assessment
MD 1 Workplan Activity Q1 Q2 Q3 Q4 Task 1 • Top 10 Program Risks as of 06/24 • Organization announcement timing still unclear • IT requirements not fully understood • No plans to address cultural misalignment • Success of communication not currently planned to be measured Program Risk Management Task 1 Illustrative Task 1 Task 1 Initiative Current Quarter Cum. Qrtly. Breakdown Jan. Feb. Mar. 4Q97 1Q98 2Q98 The transition to full-scale rollout and implementation of initiatives is supported by a clear tracking process Phase III Establish Structure and Plan Integrated Planning and Initial Rollout Full-Scale Rollout Implementation Size = $ Saved Red Risk Yellow Green 6 12 18 Time to Complete Implementation Initiative Status Management Cost Saves and Growth Achievement Communication
Red Amber Green Green Criticality Amber Red Now Future Time Throughout the effort, managing risk is a formalized methodology; adherence facilitates a fair and robust decision making process Illustrative Risk Reduction Project Risk Prioritization Risk Identification Risk Categorization Project Prioritization — Business Criticality And Size Risk Plans High • Business Criticality — how much does it matter if the project does not meet its objective? • A = Incremental benefit but current processes will suffice • B = Supports strategy but manageable impact if project fails/delayed • C = Important to the strategy with significant impact if project fails/delayed • D = Critical impact/must keep up with competitors/cannot continue business Project4 Project5 Significant risks need to be managed D Project6 Project1 C ProjectPlans Risks Business Criticality Unstable/sensitive assumptions create risks Project2 B Project3 Assumptions A Low High A B C D Many issues are closed by making assumptions Complexity Issues Issues are open questions Issues, Assumptions And Risks Are Inherent In The Project Plans Merger Risk Profile Benefits of Proactive Risk Management Challenges Decision Making Planning/ Execution Reporting • Cross organizational input and dedicated facilitation ensures objective input • Milestone risks associated with decision timing are derived from process-wide initiatives • Risk process highlights resource vulnerabilities. Sense of urgency associated with the process forces discussions and actions • Proactive management and facilitation objectively evaluates all communication risks. Forum offers participants a chance to agree or disagree • Concise updates focused on cross-organizational risks direct attention where it is needed • Clear assignment of risk ownership and action responsibilities eliminate confusion Source: A.T. Kearney Merger Integration
To assess and achieve their synergies, all teams can leverage a number of A.T. Kearney’s proven methodologies and tools as appropriate Illustrative Supporting Methodologies and Tools Increasing Sales Force Effectiveness Streamlining the Organization Reducing Purchased Costs StreamliningProductPortfolios andNetworks Leveraging Assets • Increase revenue productivity of sales force • Increase knowledge and value-added selling capabilities • Explore channel leverage (i.e., Dealer /Reseller network) • Sales force effectiveness • Cross-selling • Sales Force Effectiveness Methodology • Customer Retention Methodology • Determine management and governance structure • Integrate offices • Align HR policies and procedures • Finance / Accounting • Legal / Regulatory • IT • HR • Corporate Center Rationalization • Leverage corporate spend • Leverage purchasing volumes • Direct materials • Purchased services • Indirect materials • Capital expenditures • Strategic Sourcing • E-Sourcing (eBreviate) • Market exchange strategy (LSN) Objectives: • Rationalize product offering and customer base • Evaluate and implement optimal network strategy • Product Offering • Customer requirements • Network cost and capacity • Product Portfolio and Network Rationalization Methodology • Operating Networks Integration • Maximize asset utilization • Bottling plant consolidation • Warehouse consolidation • Realize network synergies • Fixed assets • Capital expenditures • Inventory • Procurement • Supply Chain Transformation • Operating Asset Effectiveness Focus Areas: Methodology and Tools
Sample Preliminary Scenario Number of Variants Proliferation Level Rapid benefit delivery is feasible through integrating the operating network Key Assessments for Integrating Operating Networks Several Iterations Market Requirements SKU Tree Manufacturing Capabilities Network Configuration SKU tree Current Sites: 2 Future Sites: 1 SKU 2 SKU 1 SKU 3 3 • • • A 1 • • • B 1 1 1 2 Classic Compact Classic Compact Classic • • • • • C Current Sites: 8 Current Sites: 2 GBH GBH EBH Mechanical EBH Mechanical GBH 3 • • • • • • • Future Sites: 5 Future Sites: 1 D Blue Blue White White White White White 2 • • • • • • • E 1 Menthol/Euca • • • • • • • E Current Sites: 4 Current Sites: 1 Classic Compact Classic Classic Compact Compact Classic 2 • • • • • • • Future Sites: 3 Future Sites: 1 F Current Sites: 3 Resealable Resealable Resealable Resealable Resealable Resealable Resealable 1 • • • • • • • G Future Sites: 2 • • • • • • • • • • • • • • • • • • • • • • • • • • • • H 6 12 18 24 6 12 18 24 6 12 18 24 6 12 18 24 6 12 18 24 6 12 18 24 6 12 18 24 4 • • • • • • • • • • • • • • • • • • • • • • • • • • • • I Current Sites: 2 1 1 1 1 1 1 1 1 1 1 1 1 1 1 1 1 1 1 1 1 1 1 1 1 1 1 1 1 28 Future Sites: 1 Current Sites: 1 Future Sites: 1 A.T. Kearney 6/Document#/I.D. 1 36 Local MarketRequirements ManufacturingCapabilities NetworkConfiguration Portfolio • What are the market requirements • What is the current/future competitive positioning • What distribution channels are growing fastest • What can be produced • Where • How does throughput vary by location and plant capability • What are the capacity constraints • Which are the costs of transportation, handling and inventory • Which is the most cost efficient network configuration • Are there cost synergies with other Dannon products • Which SKUs are offered • Which specific product characteristics • Which emerging technologies/competitive offerings • How is product bundled and promoted
Which entity in the supply chain should develop a capability is determined by the business’ scale and strategic objectives High • Strategic Alliance • Develop strong relationships with key supply chain partners that have the required capabilities • Maintain very high levels of cross-functional involvement • In-House • Invest in resources and people to develop world-class capabilities • Activity Strategic Importance • How core is the activity? How “entangled” is it with the rest of the organization? • How critical is it to maintain control and involvement in the activity? • Is the activity an area of competitive advantage today? In the future? • Outsource • Outsource activity to capable provider • Organize related activity to minimize transaction costs with outsourced provider • Rationalize • Depending on true switching costs and investment requirements either continue to develop capability in-house or outsource Low Low High • Potential For Internal Capability Development • In the short- to medium-term can the required capability be developed in-house to be highly efficient and effective in an activity?
Differences in each company have to be understood, and decisions made on both the operating model of the joint venture going forward – a formal process can help in facilitating this thinking Corporate Center Rationalization Methodology Step 1 Step 2 Step 3 Step 4 Identify the Operating Model and Detailed Operating Structure and Characteristics of Each Firm Make the High Level Choices As to How the Company Operates Going Forward Determine New Operating Model, and Appropriate Benchmarks Define and Align Support Functions C = Corporate B = Business Unit O = Outsourced DWNA DWNA/JV Partner Support Function Alignment Business Group Model Holding Strategic Holding Strategic Business Group Model Company Architect Operator Functional Company Architect Operator Functional BG1 • ? BG1 ? Finance Strategy BG2 •? • Accounts Payable B C C C • P/L accounting B C/B C C BG2 ? BG3 • ? • Consolidation/ corporate C C C C Financial Control reporting BG3 ? • Tax B C/B C C Capital Allocation • Treasury B C C C Other Stand Alone • Planning/budgeting B B C C/B Human Resources Resource Management • Benefits/administration B/O C/O C/O C/O JV Partner • Benefits planning B/O C/O C/O C/O • Compensation planning B C/B C C Accountability Business Group Model Corporate Staff Size BG1 • ? Autonomy BG2 • ? Marketing BG3 • ? Create Joint Venture Organization Staff Placement • Effective, fast rationalization and savings • Best practices “Corporate Center”
Strategic sourcing is a powerful methodology for leveraging the combined spending base and procurement capabilities of the merged organization Seven Step Strategic Sourcing Methodology 1. Define Sourcing Categories 2. Develop Sourcing Strategy 3. Generate Supplier Profile 4. Select Implementation Path 5. Select Competitive Supplier(s) 6. Operationally Integrate Supplier(s) 7. Continuously Benchmark and Monitor Supplier Improvement • Profile spend • Identify specifications • Unbundle as appropriate • Review supply category profile • Assess procurement processes • Review trends • Evaluate total cost and savings targets • Proven database and management tools • Existing supply category profiles • Assess supply category business impacts • Confirm sourcing strategies • Validate total supply chain perspective • Detailed understanding of supply market • Market competition • Industry economics • Review supplier lists and supplier capabilities • Prescreen list to develop short list of suppliers • Existing supplier lists available globally • Select supplier development or negotiation path including use of market exchanges • Define initial negotiation strategy • Experience in the beverage industry, including bottled water • Negotiation training • Tailor and issue RFPs • Analyze responses • Develop targeted negotiation strategy • Negotiate a deal • Electronic procurement tools • Internet RFPs • On-line auction tools • Benchmarks • Complete implementation templates • Gain buy-in to supplier changes • Coordinate new supply chains • Implement systems to monitor results • Implementation templates • Embed supplier monitoring processes • Implement market monitoring tools • Periodically re-evaluate supplier competitiveness and performance • Performance measurement tools • Technology-enabled data capture process Key Elements A.T. Kearney IntellectualCapital Employed
Product Buyer Specification Leverage Improvement Joint Reached Info. Process Transparency Improvement Global Relationship Sourcing Restructuring Strategic Sourcing has a goal of delivering bottom line savings through core elements: strategic purchasing; demand management and change management Strategic Sourcing Approach Overview StrategicPurchasing DemandManagement Change Management TangibleResults • Reevaluate external purchases and restructure supplier relationships to get best value for the company (price, quality and service) • Reduce costs by decreasing or eliminating the demand for goods and services • Embed achieved savings by transforming organization, structure, processes, policies, and systems Demand Reduction Hierarchy Aggressive Greatest Organization and Skills Process Systems EliminateDemand Strategic Procurement Vision Reduce Quantity ApplicationMethodology Procurement Policies Reduce Quality Strategic Sourcing Redesigned Processes Reduce Frequency Organizational Technology Tools Structure and (Information Systems) Infrastructure Implementation of Substitute Process Linkages Impose Onerous Approvals Performance Metrics Heighten Cost Awareness Transition Management, Communications, Training Conservative LowestOpportunity
Strategic Sourcing is effective in integration environments since it can be started immediately, deliver major savings and contribute to building the new company Integration-Related Strategic Sourcing
The sales productivity effort should include Customer Retention Methodology to understand the key risks for customer defection and action plans to address them Customer Retention Methodology Overall Process Step 1 Defection/Loyalty Segmentation Medium-Term Actions Step 2 Step 3 High Value Customers Create Targeted Retention Programs • Retention bonus/incentives • Differentiated service levels • Enhanced product applications • Customized communication • Customized product benefits • Early warning Contribution Value Channel Management • Channel migration pricing • Price rise • Passive customer service Retention
Our approach to sales productivity includes benchmarks, analysis of overlap and identification of near term growth opportunities Illustrative Efficiency Effectiveness Average Training Per Sales Rep Account Win/Loss Performance Number of Reps Serving Accounts Total Sales Managed by Sales Rep Sales Dollar Per Sales Rep Price $ Marketing # A B $ $ # Salesforce Productivity Benchmarks New Products Quality $ A B Network Services Service A B Capability Laptop A B Co. A Co. B Co. A Co. B Co. A Co. B Co. A Co. B Overlap Near Term Growth Opportunities Region Geography Sales Territory Opportunity to Introduce Co. B Products Strategically Manage Relation-ships Major Co. B Co. A Integration Leverage Opportunities Co. A Position Opportunity to Introduce Co. A Products Minor Minor Major Coverage Overlap Sales Overlap Co. B Position
Information Technology should be viewed as an enabling mechanism for achieving merger goals Technology Focus in a Merger Product/Market Focus Context Illustrative Anticipated Benefits Cost Reduction Cost/Revenue blend Revenue Enhancement Product Focus Product Expansion Synergistic Merger • In high-overlap mergers, the emphasis is on cost reduction. Market analysts expect to see tangible actions being taken early in the merger program • For synergistic mergers, timescales to achieve benefits may be longer, and I.T. integration can operate within a longer planning horizon to support revenue enhancement • The common factor with all of these merger forms is the need for a smooth integration process that eliminates the risk of customer or employee defection • Channel rationalization • Systems enhancements to support new products • Major systems revisions to support cross-selling and geographic/channel expansion • Review of global data centers and core systems Complementary or New Product Lines High Overlap Geographic Expansion • Eliminating duplication between systems • Rationalizing service agreements • Reducing license fees • Reducing support costs • Pursue data center rationalization • Standardization on common systems • Standardization on common products Overlapping Market Focus In-Market Merger Out-Market Merger Market Overlap Source: A.T. Kearney Merger Integration
Business Initiatives Defined 80% Supporting IT Initiatives Defined Deployment/ Integration of IT Initiatives 10% Time IT must quickly deliver tangible business driven results in a timely fashion and not necessarily the “best” possible solution to achieve value creation commitment Illustrative Percent of Initiatives Defined Over Time Representative IT Support Requirements • Cost imperatives • Rapid integration to capture synergies as committed to the street • Product rationalization • Product and plant integration • Business synergies • E-business opportunities • New product/ new market opportunities • Cross selling • Leverage existing products to new geographies • Act on future acquisition opportunities • Business continuity • Statutory and performance reporting • Integrated strategic measurement • Merger integration progress IT’s challenge is to stay in tune with business initiatives to understand the scope of effort, develop the IT response, and to integrate with the corporate IT direction
The Steering Committee and Integration Office manage the overall program and coordinate decentralized project teams through the Integration Office Steering Committee • Develop/communicate objectives and targets • Develop merger guiding principles • Sign off on major issues/decisions • Set overall direction for integration • Provide resources and eliminate roadblocks • Implement top-down communication • Focus on continuing operations Integration Office • Coordinate integration process, scope activities • Implement merger planning, integration and reporting — create and manage the “master plan” • Conduct frequent work task reviews with teams • Facilitate overall change management • Maintain a scorecard to track deliverables and benefits • Prioritize enterprisewide issues and make recommendations • Manage communications • Install and manage effective merger risk management Market Facing Teams Value Capture Teams Enabler Teams Integration Teams Integration Teams Integration Teams Integration Teams Integration Teams Integration Teams Integration Teams
Each component of the project had specific roles and responsibilities Integration Roles Deliverables Steering Committee • Strategic direction, operating philosophy, and governance structure • Guiding principles • Communication of key messages • Scope and actions • Overall objectives and goals • Set the strategic direction and principles for integration • Sign-off on major issues/decisions • Top-down communication throughout the integration process • Focus on continuity of growth, customers’ issues Integration Office • Overall project key success factors • Master project plan and risk assessment • Transition reporting including benefits tracking and risk management • Communication implementation • Coordination, planning, integration, reporting and communication • Monitors implementation of organizational models • Prioritize issues / initiatives • Facilitate overall change management • Risk identification and management Decentralized Integration Teams • Transition plans • Organizational assessment and design • Progress reports with targets achieved • Risk assessment • Performance measurements defined • Propose transition strategy for the area • Prepare the transition work plan • Detailed organizational assessment • Identify merger benefits and implement tracking mechanism • Implementation of transition plans
Each of these three teams have clearly defined roles and responsibilities Key Pre-Merger Integration Set-up Responsibilities Steering Committee Integration Office Value Capture Teams • Communicate objectives and goals of merger • Establish and communicate the “Merger Guiding Principles” • Identify and appoint Integration Leader • Identify and appoint team leaders • Communicate formation of Integration Office and Value Capture Teams • Communicate executive commitment to the integration program • Communicate team leader and team member commitment • Ensure regular and consistent top-down communication across all regions and groups • Define roles of members • Identify team members • Establish cost savings & revenue synergies targets as a precursor to the “Merger Integration Scorecard” • Initiate the appropriate MIS/IT infrastructure • Support development of high-level business line/functional plans • Identify, at a high level, major risk areas • Co-ordinate the senior management review cycle of these plans • Assemble the first “Master Plan” • Develop tracking baseline • Issue initial communications to stakeholders, as required • Establish risk management process • Identify team members • Create team charters • Prepare for Kickoff Meetings to introduce team members and provide initial orientation • Agree on optimal processes to coordinate each team • Begin data collection and hypothesis testing • Develop Day 1 Plans • Develop organizational, customer and/or cost profiles falling within team scope • Conduct interviews to gather additional qualitative insight regarding operating processes and styles • Develop joint vision for combined organization
The Steering Committee must apply significant early effort to communicate the new company’s strategy, operating philosophy and governance Issues to Address
In addition, the Steering Committee should establish a clear set of guiding principles Case Examples Merger Guiding Principles 1. “This is not the customer’s merger” — Major focus on avoiding customer inconvenience and loss of customers. “Customer service can only change for the better.” Cost savings are important, but second to customer focus 2. Focus analyst expectations on the longer term — Savings goals defined as $1 billion expense “run rate” reduction by end of three years, eliminating short-term, quarter-by-quarter focus 3. Appearance of tight control through Command Center — Command Center used as a single point of contact for all external communications. External presentations conducted in “war room” to exhibit corporate controls in place 4. Relentless tracking of risk and interdependencies — All merger projects required to use risk and interdependency tracking approach. These were integrated by the Command Center to provide corporate perspective on risk. Focus of internal meetings on risks and customer issues, not on successes 5. Systems focus on smooth Integration — “Suites” of systems should be selected rather than pursuit of optimal elements from each organization. Extensive use of “bridges and workarounds” to maintain critical controls while expediting the process 6. End-to-end systems and process testing — No system or process should be considered ready for processing until it has been tested in a “dress rehearsal” mode (usually two dress rehearsals) 7. “1 + 1 = 3” volumes — Strong encouragement of business units to focus on post merger business volumes 1. Fast and fair — accept that we will make mistakes, but give us credit for being smart enough to be able to recognize them, and not so proud that we can not change 2. Leadership must be evident/inspiring — not holed up in the corner offices/board rooms, but out in evidence with key customers and our employees 3. Harmonization — this has to be a key goal with respect to strategy, key policies, business processes, etc. 4. Minimize ambiguity — be clear in plans, timing, decisions(don’t fuzzify - “don’t know” is ok 5. Short term bias towards the customer — don’t lose sight of the business whatever we do 6. Overcommunicate — you can never do enough here 7. Integration study team should be advisory and separate from management — let management decide and let advisors advise, don’t mix too closely 8. Seek acquaintanceship-building opportunities — informal, formal 9. Emphasis on flexibility/change/fluidity — accept change as a way of life, strategic agility is key, it is management’s first responsibility to take risk (change, growth, wealth creation can only happen by taking risk)
The role of the Integration Office evolves over the course of the integration Establish Structure and Plan DayOne Integrated Planning and Initial Rollout and Implementation Support Full-Scale Rollout and Implementation Support Transition of Integration Office Responsibilities • Creation of Integration Office with leadership assigned • Define roles of members • Establish and communicate the “Merger Guiding Principles” • Establish cost savings targets as a precursor to the “Merger Integration Scorecard” • Initiate the appropriate MIS/IT infrastructure • Support development of high-level business line/functional plans • Identify, at a high level, major risk areas • Co-ordinate the senior management review cycle of these plans • Assemble the first “Master Plan” • Update Merger Steering Committee • Issue initial communications to stakeholders, as required • Establish risk management process • Develop further project infrastructure • Refine and monitor the “Master Plan” • Finalize key objectives, and establish the “Merger Integration Scorecard” • Work with line management to finalize detailed Integration Teams required and their scope, objectives and timelines • Focus on ensuring detailed, comprehensive project management • Establish initial prioritization framework • Refine reporting tools • Preliminary assessment of key risks and interdependencies • Update Integration Steering Committee on plans • Manage stakeholder communications • Update Integration Steering Committee on plans and progress toward targets • Maintain the “Merger Integration Scorecard” • Support development and execution of detailed implementation plans by decentralized Integration Teams • Ensure consistency of execution • Run the continuous risk management process • Stabilize or desensitize risks as appropriate • Champion “quick win” projects to reinforce confidence of key stakeholders • Ensure that key milestones are met, proposing resource reallocations as necessary • Manage stakeholder communications • Develop contingency plans as necessary
A Command Center to monitorand controlthe process of the merger can be established Command Center Layout Example Functional Areas End-To-End Testing “Dress Rehearsals” Identified problems;implemented fixes SystemA SystemB SystemE Business/ Geographic Units Time ActualConversion DressRehearsal1 DressRehearsal2 SystemC SystemD Testing Source: A.T. Kearney Merger Integration
Market Share ROE Business Line SystemE SystemA SystemB Time DressRehearsal1 DressRehearsal2 ActualConversion SystemC SystemD Testing Phase I Phase II Jan Feb Mar Apr May The Command Center monitors and tracks critical information from each area of the integration and provides an overall view of progress to ensure success Example “Command Center” Information Reporting Key Performance Indicators Shareholder Value Created Network Evaluation Market Positioning Client base Market Value (Pre-merger) Invested Capital SVC Economic Returns Aggregate Portfolio Sensitivity Integration Plan Revised Retail Organization Integration Framework Potential Losses Basis Points Change Planned Budgets Expected Cost Reduction “Dress Rehearsals” End-to-End Testing Source: A.T. Kearney Merger Integration
There are five main advantages of implementing the Benefits Tracking and Reporting (BTR) system BTR Implementation • Facilitates the identification and realization of cost synergies and related costs, whether they be in a merger environment, a restructuring program, a strategic sourcing program or any general cost reduction program • Provides key constituents with access to periodic, data-driven status of program initiatives • Creates a forward-looking risk and milestone tracking system to alert key stakeholders about potential synergy shortfalls or issues • Provides evidence that cost synergies have been achieved • Provides information for a common program communication vehicle for executive management
Project Risk Assessment Summary of Manpower Reductions & Savings The BTR is a web-enabled system that allows users to input and update key project data easily, quickly and frequently. The output of the system is used to create consolidated project and program-level reports Web-enabled User Interface (Via a Terminal Server Application) Management Reports (Generated through Excel and PowerPoint) Benefits Achievement, Progress against Plan & Revised Forecasts BTR Database The BTRfront-end and back-end are completely customizable and scaleable to meet the needs of any engagement size and scope
The eight components of the BTR consist of one-time and ongoing regularupdate reporting requirements 1) Project Profile • Defines projects and owners 2) Project Milestones • Identifies key milestones with accountable owners and completion dates 3) Project Interdependencies • Describes interdependencies with other teams, actions required and impact if actions are not taken 4) Headcount Reductions Template • Tracks actions resulting in net headcount reductions • Tracks headcount-related savings and costs 5) Non-Headcount Savings and Cost Template • Tracks non-headcount savings and associated implementation costs 6) Capital Expenditures Template • Tracks capital expenditures related to the project 7) Asset Sales Template • Tracks proceeds from asset sales related to the project • Tracks related asset write-downs 8) Risk and Key Milestone Tracker Template • Tracks progress against key milestones • Highlights areas of potential risk • Identifies actions required to resolve issues and remove barriers One-time Reporting Regular Update Reporting
Updates to the system are used to track progress against targets. The system can track multiple parameters, including - savings, costs, headcount and project status Web-enabled User Interface (Via a Terminal Server Application) Management Reports (Generated through Excel and PowerPoint) Headcount Reductions and Related Savings/ Costs Summaries by Project Team Non-Headcount Savings and Related Implementation Costs Monthly Achievement & Forecast Capital Expenditures Other Restructuring Charges (i.e. Asset Sales & Write-Offs) Monthly Progress Against Plan and Forecast Risk and Key Milestone Tracker Project Risk Assessment
The Steering Committee and client team leaders are provided with summaries of progress against plan on a regular basis Illustrative Financial Reports Run Rate Saves — Project SC01 Run Rate Saves — Supply Chain Integration Team Run Rate Saves — Integration Program (US$ MM) 300 200 Monthly Actuals Original Plan Revised Forecast 100 0 Jul Aug Sep Oct Nov Dec Jul Aug Sep Oct Nov Dec Jan Feb Mar Apr May Jun
RT4b PP7 RT4a A risk-tracking system is implemented to track initiative progress and to help anticipate delays, identify barriers to success and highlight areas of concern to leadership Illustrative Example Initiative Risk Assessment Size of Savings Red <$1MM $1MM–$5MM $5MM–$10MM AA1 SC6 Risk Rating I PP4 Yellow >$10MM SC3 SF11 SC5 TBD ST10 SC7 SC4 EM1 CS2 ST9 MD11 RT6 MD31 ST7 MD34 On Hold EM4 MD21 EM7 EM2 SC1 MD15 MD32 RT5 MD33 Green I PP2 MD37 RT3 ST2 ST8 EM3 EM5 MD6 MD29 MD1 SC11 ST1 SF8 MD27 MD2 PP5 EM6 MD26 CS5 MD19 CS1 CS4 MD18 01/02 12/99 06/00 12/00 06/02 Expected Completion Date