Download
1 / 28
290 likes | 509 Views
Chapter 10 Facility Location in a Global Environment. IDS 605 M. Busing Spring 1999. Facility Location. Facility Location is the placement of facility with respect to customers, suppliers and other interacting facilities. It should consider: Operating costs Customer convenience

E N D
Chapter 10Facility Location in aGlobal Environment IDS 605 M. Busing Spring 1999
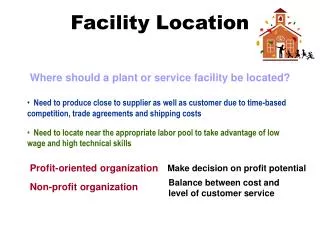
Facility Location • Facility Location is the placement of facility with respect to customers, suppliers and other interacting facilities. It should consider: • Operating costs • Customer convenience • Transportation costs • Access to key related services such as banking and educational opportunities • Strategic factors Transparency 10.1
Location as a Strategic Decision 1. Long-term commitment 2. Linked to customer base 3. Regional facility supplies specific area 4. Product facility supplies globally 5. Combination of regional and product facilities Regional or Global Transparency 10.2
Factors Affecting theLocation Decision • Strategic nature of decision • Quantitative factors • Government incentives • Qualitative factors Transparency 10.3
Data for Site inIndianapolis, Indiana (Slide 1 of 2) Variable Production Costs Type Rate Projected usage Labor Material Utilities Transportation Welding Electrical General assembly Sheet metal Threaded fasteners Electrical wire Natural gas Electricity In rail Motor carrier Motor carrier Out motor carrier $10.00/hr. $12.00/hr. $9.00/hr $.40/lb. $2.00/100 $.06/lineal ft. $4.00/1,000 cu. ft. $.06/kilowatt hr. $.03/lb. (sheet metal)* $.04/lb. (fasteners) $.04/lb (wire) $20/unit (finished) 0.5 hrs./unit 0.3 hrs./unit 1.1 hrs./unit 100 lbs./unit 20/unit 70 lineal ft./unit 500 cu. ft./unit 200 kilowatt hrs./unit 100lbs./unit 5 lbs./unit 4 lbs./unit 1 Transparency 10.4a (Exhibit 10.1)
Data for Site inIndianapolis, Indiana (Slide 2 of 2) Variable Production Costs Type Rate Projected usage $2,100,000 $175,000,000 $25,000,000 Facility Overhead Initial Investment Special Considerations Land acquisition costs Building construction Plant start-up costs Initial employee training Tax abatement Low-interest loans Supplementary training expenses *Rates are given from a specific origin to a specific destination, so distance has been accounted for. Transparency 10.4b (Exhibit 10.1)
Pro Forma Operating Budgetfor One Year (Slide 1 of 2) Labor Welding Electric Assembly Total labor costs Material Sheet metal Fasteners Wire Total material costs Utilities Natural gas Electricity Total utility costs ($10.00/hr.)(.5 hrs./unit)(45,000 units) ($12.00/hr.)(.3 hrs./unit)(45,000 units) ($9.00/hr.)(1.1 hrs./unit)(45,000 units) ($.40/lb.)(100 lbs./unit)(45,000 units) ($2.00/100)(20/unit)(45,000 units) ($.06/lin.ft.)(70 lin.ft.)(45,000 units) ($4.00/1,000 cu./ft.)(500 cu./ft/unit)(45,000 units) ($.06/kwh)(200 kwh/unit)(45,000 units) $ 225,000 162,000 445,500 $ 832,500 $1,800,000 18,000 189,000 $2,007,000 $ 90,000 540,000 $ 630,000 Transparency 10.5a (Exhibit 10.2)
Pro Forma Operating Budgetfor One Year (Slide 2 of 2) Transportation Sheet metal Fasteners Wire Finished product Total transportation costs Variable costs Facility overhead * Grand total ($.03/lb.)(100 lb./unit)(45,000 units) ($.04/lb.)(5lb./unit)(45,000 units) ($.04/lb.)(4lb./unit)(45,000 units) ($20.00/unit)(45,000) $ 135,000 9,000 7,200 900,000 $1,051,200 $4,520,700 2,100,000 $6,620,700 *Some overhead costs can be variable, but to simplify the discussion in this case, we will assume all overhead costs are fixed. Transparency 10.5b (Exhibit 10.2)
Factors in Location Analysis (Slide 1 of 2) LOCATION Country Distance in miles from: Los Angeles Chicago Memphis POPULATION 1990 1980 1970 City County MUNICIPAL SERVICES Type of local government Comprehensive city plan: Date completed Underway Under consideration Number of full-time fire department personnel: Number of full-time city policemen: Percent of city streets paved: % Transparency 10.6a
Factors in Location Analysis (Slide 2 of 2) COMMERCIAL SERVICES Machine shop in city: Yes No Number Type of newspaper in city Daily Weekly Radio stations Yes No Number BANKING SERVICES TRANSPORTATION SERVICES Train Community served by railroad(s): Yes No Name(s) of railroad(s): Motor carrier Highway bus service available Yes No Number of highways serving city: Federal State Barge: City adjoins navigable river: Yes No Barge dock available Yes No Channel depth: feet. Length of season: Transparency 10.6b
Including theQualitative Factors • Integrate qualitative factors • Determine which factors are relevant to the problem • Weigh each factor • Rate each site for each factor Transparency 10.7
Examples of Indianapolis and Lexington (Slide 1 of 2) Indianapolis Lexington Weight Raw Score Raw Score Recreational activities 20 8 7 University research facilities 40 8 8 Union activities 40 4 7 Banking services 80 7 6 Available labor pool 60 7 5 Transparency 10.8a
Examples of Indianapolis and Lexington (Slide 2 of 2) Indianapolis Lexington Weighted score Weighted score Recreational activities 160 140 University research facilities 320 320 Union activities 160 280 Banking services 560 480 Available labor pool 420 300 Total 1,620 1,520 Transparency 10.8b
Analyzing Spatial Relationships • Load-Distance Method measures proximity to customers, suppliers, interacting facilities • Transportation Problem relates to the cost of transporting materials to and from multiple facilities Transparency 10.9
Distance from Facilityto Customer Transparency 10.10 (Exhibit 10.3)
Health Care UnitLocation Problem Transparency 10.11 (Exhibit 10.4)
Locating a Health Care Center Using the “Load-Distance Method” (Slide 1 of 3) Population coordinates Zip Code ai xi yi (ai )(xi) (ai)(yi) 10111 30,000 3 2 90,000 60,000 10112 25,000 2 4 50,000 100,000 10113 11,000 1.5 5.5 16,500 60,500 10114 8,000 3 7 24,000 56,000 10115 18,000 3.5 5 63,000 90,000 10116 24,000 4.5 3.5 108,000 84,000 10117 12,000 5.25 6.25 63,000 75,000 Total 128,000 414,500 525,500 Transparency 10.12a
Locating a Health Care Center Using the “Load-Distance Method” (Slide 2 of 3) where xf = Distance along the x axis from the origin to the center of gravity yf = Distance along the y axis from the origin to the center of gravity ai = The activity level (load) from the i th location to the proposed facility Xi = the coordinate on the x axis for the i th customer location yi = the coordinate on the y axis for the i th customer location Transparency 10.12b
Locating a Health Care Center Using the “Load-Distance Method” (Slide 3 of 3) The coordinates of the center of gravity are: 414,500 525,500 xf = yf = 128,000 128,000 = 3.24 = 4.11 Transparency 10.12c
Transportation Problem • Cost of moving materials between multiple destinations • Vogel’s Approximation Method • To evaluate two locations, solve the transportation problem for each location OR Transparency 10.13
Transportation Matrix forProton Consulting Service Transparency 10.14 (Exhibit 10.5)
First Assignment forProton Consulting Service Transparency 10.15 (Exhibit 10.6)
Second Assignment forProton Consulting Service Transparency 10.16 (Exhibit 10.7)
Third Assignment forProton Consulting Service Transparency 10.17 (Exhibit 10.8)
Final Transportation Matrix forProton Consulting Service Transparency 10.18 (Exhibit 10.9)
Location Decision Affects Other Operating Decisions • Alternative to on-site expansion • On-site expansion is problematic • Material handling and storage • Complex production flow • Strained communication • New technology delayed • Use of old equipment • Layering of expanded responsibilities Transparency 10.19
International Dimensions ofLocation Decision • Reasons for locating in foreign countries • Comparative Advantage • Closeness to market • Political relationships • Availability of resources Transparency 10.20
Location Analysis forService Operations • Concepts and techniques discussed so far apply to service operations • Service issues: • Minimize response time: Emergency medical services • Provide minimum coverage: Fire Protection • Mobile location: Police or security units Transparency 10.21