Download
1 / 47
470 likes | 624 Views
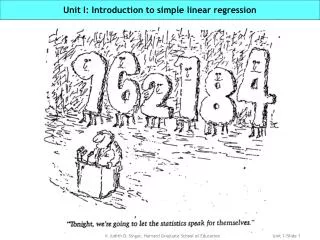
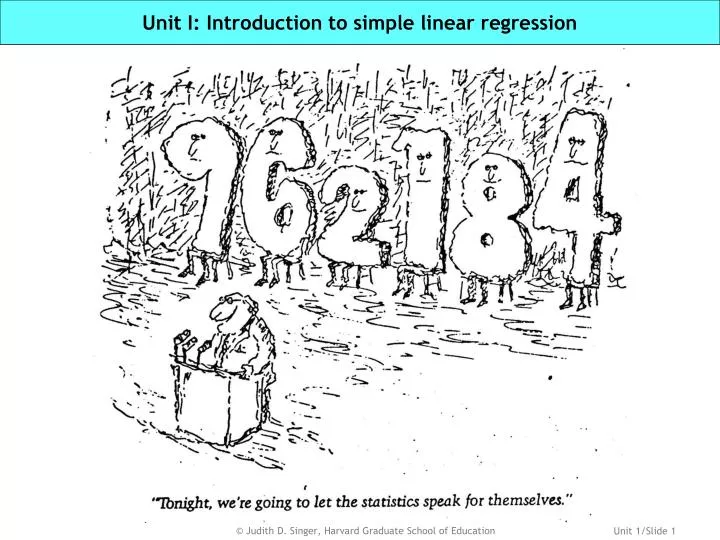
Unit I: Introduction to simple linear regression. The S-030 roadmap: Where’s this unit in the big picture?. Unit 1: Introduction to simple linear regression. Unit 2: Correlation and causality. Unit 3: Inference for the regression model. Building a solid foundation. Unit 5:

E N D
The S-030 roadmap: Where’s this unit in the big picture? Unit 1: Introduction to simple linear regression Unit 2: Correlation and causality Unit 3: Inference for the regression model Building a solid foundation Unit 5: Transformations to achieve linearity Unit 4: Regression assumptions: Evaluating their tenability Mastering the subtleties Adding additional predictors Unit 6: The basics of multiple regression Unit 7: Statistical control in depth: Correlation and collinearity Generalizing to other types of predictors and effects Unit 9: Categorical predictors II: Polychotomies Unit 8: Categorical predictors I: Dichotomies Unit 10: Interaction and quadratic effects Pulling it all together Unit 11: Regression modeling in practice
In this unit, we’re going to learn about… • The 3 trinities for describing research: 3 types of variables, predictors and research questions • Statistical models and how they differ from deterministic models • Examining predictor and outcome distributions and scatterplots • Mathematically representing the population model and interpreting its components • Using sample data to motivate a hypothesized population linear regression model • Assumptions made in postulating the simple linear regression model • Fitting the model to data—Understanding the method of least squares • Residuals—definitions and interpretations • Uses of the fitted regression model • How the fitted regression model helps improve our predictions • Explained variation—what the R2 statistic is (and what it is not) • Using the analysis of variance to estimate the mean square error (MSE)
The continuing consequences of segregationCharles, Dinwiddie and Massey (2004) Social Science Quarterly Target population: African American, Latino, Asian and White undergraduates at 28 selective US colleges & universities Sample: Representative sample of 3,924students—n’s by race/ethnicity—who participated in the National Longitudinal Survey of Freshmen (NLSF) • Variables: • Student race/ethnicity • Segregation of the HS neighborhood • Family SES—education, $, etc. • Stressful life events during college • College GPA RQ: “We seek to determine whether the high levels of African-American residential segregation experienced have continuing academic consequences” Hypothesis: “Because segregation works to concentrate poverty and the social problems associated with it, the friends and relatives of African-American students face an elevated risk of stressful life events, which undermine grade performance” Analytic approach: “Estimate a regression model to connect segregation to academic performance through the intervening variable of family stress.” Results: “African-American students from segregated neighborhoods experience higher levels of family stress than others. This stress is largely a function of violence and disorder in segregated neighborhoods. Students respond by devoting more time to family issues and their health and grades suffer as a result” Charles, C.Z., Dinwiddie, G., & Massey, D.S. 2004. The continuing consequences of segregation: Family stress and college academic performance. Social Science Quarterly, 85(5): 1353-1373.
Gray peril or loyal support?Berkman & Plutzer (2004) Social Science Quarterly Target population: All fiscally independent US school districts with > 35 students in 1989-1990. Sample: All 9,129 districts that met this criterion. • Variables: • Pct district residents who are > 60 • Pct also newly arrived • Pct also longstanding • SES and demographic controls • Per pupil expenditure (PPE) RQ: “Do large concentrations of elderly represent a ‘gray peril’ to maintaining adequate educational expenditures?” Hypothesis: “The gray peril hypothesis is a misleading caricature of more complex political dynamics…not equally applicable to all elderly. Expenditures will decline as the concentration of newly arrived elderly increases; high concentrations of longstanding elderly will have no effect or result in expenditure increases” Analytic approach: “We regress per PPE on the %age of the population over 60…and add a series of economic and demographic controls” Results: “Older residents represent a source of support for educational expenditures while elderly migrants lower spending. … The gray peril hypothesis … must be rejected” Berkman, M.B., & Plutzer, E. 2004. Gray peril or loyal support? The effects of the elderly on educational expenditures. Social Science Quarterly, 85(5): 1178-1192. Go to template for reporting education research
The 3 trinities for describing researchThe 3 types of Variables, Predictors, and Research Questions (RQs) Descriptive RQs Provide descriptive statistics for an outcome Fixed attributes (e.g., race, gender) Potentially changeable characteristics (e.g., class size, per pupil expenditures) Causal RQs Demonstrate a predictor’s causal impact on an outcome Innovations and Interventions (e.g., vouchers, a new curriculum) Covariates variables whose effects you want to ‘control’ Question Predictors variables whose effects you want to study Outcomes variables used to measure the predictors’ effects Relational RQs Identify relationships between a predictor and an outcome
Models: Simplified representations of relationships between variables Modeling people, organizations, …, any type of social unit – all the kinds of models we expect to develop and fit to data • Statistical models must allow for: • Other systematic components (not included in the model or not measured) • Measurement error • Individual variation • Mathematical models are deterministic— • Some are linear; some nonlinear, but… • All squares behave this way—once we know the “rule,” we can use it to fit the model to data perfectly. Mathematical models Statistical models • Modeling geometric shapes (e.g, squares) • Perimeter = 4(side) • Area = (side)2 Outcome = Systematic component + Residual Goal 1: Identify the systematic components and determine how they fit the data Goal 2: Assess how well we did by examining the magnitude of the residuals
How do we “do” statistical modeling? Step 1: Articulate your RQs in terms of outcomes, question predictors, and covariates (RQs often also specify the target population and sample) ...this is a matter of substance Population and Sample Population Group of interest. You want to make inferences about the target population. Sample Group that you will study in your research. Subset of the larger population Step 2: Postulate a statistical model and fit the model to sample data …what we’ll discuss in this unit Draw a sample Target Population Sample Step 3: Determine whether the relationship we think we found in this sample is happenstance or whether we think it really exists in the population …what we’ll discuss in Unit 3 Make inferences
Clarifying the “standard” terminology Outcome Variable whose behavior we are trying to explain Response Dependent variable Left-hand side variable Y Predictor Variable we are using to explain the variation in the outcome Independent variable Right-hand side variable X Relationship How two variables relate to each other, without implying causality Association Correlation Covariation Term Definition Synonyms Let’s get started by studying one of the oldest social science RQs: nature vs. nurture...
Studying the origins of “natural ability”: Meet Sir Francis Galton(16 February 1822 – 17 January 1911) Didn’t have data on “intelligence” so instead studied HEIGHT Research interest: “Those qualifications of intellect and disposition which … lead to reputation” • Although a self-proclaimed genius who wrote that he could read @2½, write/do arithmetic @4, and was comfortable with Latin texts @8, he couldn’t figure out how to model these data(!) • He went to JD Dickson, a mathematician at Cambridge, who formalized the relationship by developing what we now know as linear regression Galton’s “genetic utopia”: “Bright, healthy individuals were treated and paid well, and encouraged to have plenty of children. Social undesirables were treated with reasonable kindness so long as they worked hard and stayed celibate.” More than you ever wanted to know about Galton
From physical attributes to mental abilities: Meet Sir Cyril Burt(3 March 1883 – 10 October 1971) • Growing accusations • In 1973, Arthur Jensen, a supporter of Burt, noted “misprints and inconsistencies in some of the data” • In 1974, Leon Kamin noted how odd it was that Burt’s correlation coefficients remained virtually unchanged as the sample size increased (r=.770, r=.771, and r=.771) • In 1976, a London Sunday Times reporter tried to find the RAs and concluded that they did not exist • In 1979, The British Journal of Psychology added the following notice to Burt’s 1966 paper: “The attention of readers of the Journal is drawn to the fact that it has now been established that this paper contains spurious data” • In 1995, an edited volume with 5 essays, Cyril Burt: Fraud or Framed (Oxford), found evidence of sloppy writing, cutting and pasting of text, but perhaps not fraudulent data • Debate continues to this day—and with Burt long dead, the conclusion may be that we’ll never know • Much more info under “Supplemental Resources” on the S-030 website” Research interest: Heritability of IQ:Can we predict the IQs of identical twins raised in “foster” (adoptive) homes from the IQs of their siblings raised in biological parents’ homes • Over a 30 year period, he & two RAs—Miss Howard and Miss Conway—accrued data on 53 pairs of separated twins • 15 pairs in 1943 • Up to 21 pairs in 1955 • Up to 53 pairs in 1966 • “‘Intelligence’, when adequately assessed, is largely dependent on genetic constitution” (Burt, 1966)
IQ scores for Cyril Burt's identical twins reared apartResults of PROC PRINT Predictor (X): OwnIQ Outcome (Y): FostIQ RQ: What’s the relationship between the IQ of the child raised in an adoptive home and his/her identical twin raised in the birth home? n = 53 ID OwnIQ FostIQ 1 68 63 2 71 76 3 73 77 4 75 72 5 78 71 6 79 75 7 81 86 8 82 82 9 82 93 10 83 86 11 85 83 12 86 94 13 87 93 14 87 97 15 89 102 16 90 80 17 91 82 18 91 88 ID OwnIQ FostIQ 19 92 91 20 92 96 21 93 87 22 93 99 23 93 99 24 94 94 25 95 96 26 96 93 27 96 109 28 97 92 29 97 95 30 97 112 31 97 113 32 99 105 33 100 88 34 101 115 35 102 104 36 103 106 ID OwnIQ FostIQ 37 105 109 38 106 107 39 106 108 40 107 108 41 107 101 42 108 95 43 111 98 44 112 116 45 114 104 46 114 125 47 115 108 48 116 116 49 118 116 50 121 118 51 125 128 52 129 117 53 131 132 “Heritability”
Distribution of the outcome (FOSTIQ) and the predictor (OWNIQ)Results of PROC UNIVARIATE Mean Median 100 Mean Median 100 sd 15 sd 15 Distribution is symmetric with reasonable tails Distribution is symmetric with reasonable tails The UNIVARIATE Procedure Variable: FostIQ Basic Statistical Measures Location Variability Mean 98.11321 Std Deviation 15.21343 Median 97.00000 Variance 231.44848 Mode 93.00000 Range 69.00000 Interquartile Range 20.00000 Stem Leaf # Boxplot 13 2 1 | 12 58 2 | 12 | 11 566678 6 | 11 23 2 | 10 56788899 8 +-----+ 10 1244 4 | | 9 55667899 8 *--+--* 9 1233344 7 | | 8 66788 5 +-----+ 8 0223 4 | 7 567 3 | 7 12 2 | 6 | 6 3 1 | ----+----+----+----+ Multiply Stem.Leaf by 10**+1 The UNIVARIATE Procedure Variable: OwnIQ Basic Statistical Measures Location Variability Mean 97.35849 Std Deviation 14.69052 Median 96.00000 Variance 215.81132 Mode 97.00000 Range 63.00000 Interquartile Range 20.00000 Stem Leaf # Boxplot 13 1 1 | 12 59 2 | 12 1 1 | 11 568 3 | 11 1244 4 | 10 566778 6 +-----+ 10 0123 4 | | 9 56677779 8 *--+--* 9 011223334 9 | | 8 56779 5 +-----+ 8 1223 4 | 7 589 3 | 7 13 2 | 6 8 1 | ----+----+----+----+ Multiply Stem.Leaf by 10**+1 Return to fitted line
Examining the relationship between Y and XResults of PROC PLOT and PROC GPLOT (stands for “Graphics Plot”) Learn the Standard Terminology Plot of Y vs. X Plot of FostIQ vs. OwnIQ Plot of FostIQ*OwnIQ. Legend: A = 1 obs, B = 2 obs, etc. FostIQ | 140 + | | A | A | A 120 + A | A A A A A | B | A A CA A | A A A A 100 + B A A | AA A AAA A | A A A AA | AA AA A | A A A 80 + A | AA A | A A | | A 60 + -+-------------+-------------+-------------+-------------+- 60 80 100 120 140 OwnIQ PROC PLOT—an old style “line printer” graph PROC GPLOT—a much more aesthetically pleasing graph
Five questions to ask when examining scatterplots Direction of relationship? Any unusual observations? Magnitude of relationship? Linearity of Relationship? Strength of relationship? Same strength Same slope
What do we see in the plot of FostIQ vs. OwnIQ? None Positive • slope 1 Fairly strong—points tightly clustered, but some variability Approximately linear Any unusual observations? Direction of relationship? Magnitude of relationship? Linearity of Relationship? Strength of relationship?
The Importance of Axis Scale and Range in Examining Relationships A Different Relationship? Plot from Last Slide Note the difference in the axes!!! Simply by adjusting the SCALE and RANGE of each axis, we can make the relationship look different. But, the magnitude and strength are the same!
The Importance of Axis Units in Examining Relationships We also need to pay attention to the UNITS (e.g., dollars vs. thousands of dollars, or months vs. years). Wisconsin has salary data for all of its school teachers and administrators available on-line. These plots come from a random sample of 728 teachers from across the state. For more information, visit: http://dpi.wi.gov/sig/dm-stafftchr.html Note that the scale and range are the same, but the UNITS are different
How do we statistically model the relationship between Y and X?Step 1: Decide on the model’s functional form In theory, we could fit a model using most any functional form Why are straight lines so popular? Mathematical simplicity A straight line is one of the simplest mathematical relationships between variables—makes our work very tractable Transformations to achieve linearity In Units 5&10, we’ll learn how to use the straight line machinery we’re developing to fit curves to data Actual linearity Many relationships – such as that in Cyril Burt’s data – are indeed linear Limited range of X may yield linearity Range restrictions are common in social research
How do we statistically model the relationship between Y and X?Step 2: Mathematically represent the model’s functional form Intercept: Value of Y when X=0 (even if X=0 isn’t an observed value) Slope: Difference in Y per 1 unit difference in X So… If we have sample data and we identify the line that “best” describes the observed pattern, is that our statistical model? Two points—any two points—determine the line 1 Slope’s sign indicates whether the relationship is positive (+) or negative (-) • NO! For two reasons: • Statistical models describe hypothesized behavior in the population, not in any particular sample. The model itself is imagined; we will never really see it • The equation we’ve written so far (incorrectly) assumes a fixed functional relationship between Y and X—it does not allow for individual variation Y = intercept + slope*X Y = b + m*X Y = m*X + b
What do we mean by individual variation? Raised by birth mother IQ=120 IQ=120 IQ=120 IQ=120 Taken together, all adoptees in the population (not just these 4 below) whose siblings have an IQ of 120 have an average IQ; that’s what we’d like our model to estimate IQ=118 IQ=123 IQ=117 IQ=121 But we expect any particular adoptee’s IQ to differ from the population average we’re trying to estimate because of individual variation
How do we statistically model the relationship between Y and X?Step 3: Postulate a linear regression model “population parameters” or “regression coefficients” to be estimated outcome predictor Random error Outcome = Systematic component + residual Where we include the subscript ito emphasize that the model describes behavior of Y for individual cases (MORE ON SUBSCRIPTS) Understanding the model algebraically Remember that a model describes what we think exists in the population; you need to be able to imagine that it’s possible to envision having data on the entire population Understanding the model graphically
From sample data to population model: Understanding what we’re hypothesizing Y Y|x3 Y|x2 Y|x1 X … x1 x2 x3 ID OwnIQ FostIQ 19 92 91 20 92 96 21 93 87 22 93 99 23 93 99 24 94 94 25 95 96 26 96 93 27 96 109 28 97 92 29 97 95 30 97 112 31 97 113 32 99 105 33 100 88 34 101 115 35 102 104 36 103 106
From population model to sample data:How do we fit the hypothesized model to observed data? Y Y|x3 Y|x2 Y|x1 X … x1 x2 x3 Population model Fitted model “Hats” denote estimates No error term
Understanding the (ordinary) least squares (OLS) criterion Predicted values (ŷi) are estimated using the fitted line Observed values (yi) are the sample data points So a “good” line would go through the “center” of the data and have small residuals (yi- ŷi); …perhaps as small as possible??? Least squares criterion selects those parameter estimates that make the sum of squared residuals as small as possible (for this particular sample) Residuals (yi - ŷi ) are the distances between the observed and predicted values at a given value of X Ordinary Least Squares (OLS) criterion: Minimize the sum of the squared residuals 2 How do we find the “good” line that has the smallest residuals possible?
Four assumptions about the population required for LS estimation Y|x3 Y|x2 Y|x1 • At each value of X, there is a distribution of Y. These distributions have a mean µY|X and a variance of σ2Y|X • The straight line model is correct. The means of each of these distributions, the µY|X‘s, may be joined by a straight line. Y • Homoscedasticity. The variances of each of these distributions, the σ2Y|X’s, are identical • Independence of observations. • At each given value of X (at each xi), the values of Y (the yi’s) are independent of each other (we can’t see this visually…) So how do we evaluate this assumption? We won’t; it’s another class! X … x1 x2 x3
Results of fitting a least squares regression line to Cyril Burt’s dataResults of PROC REG Check for sample size Verify outcome and predictor We’ll discuss these in Unit 3 We’ll discuss this in a bit Slope: Difference in Y per 1 unit difference in X. On average, each 1 point difference in OWNIQ is positively associated with a 0.91 point difference in FOSTIQ. Intercept: Value of FOSTIQ at OWNIQ=0 The REG Procedure Model: MODEL1 Dependent Variable: fostiq Number of Observations Read 53 Number of Observations Used 53 Analysis of Variance Sum of Mean Source DF Squares Square F Value Pr > F Model 1 9250.65939 9250.65939 169.42 <.0001 Error 51 2784.66136 54.60120 Corrected Total 52 12035 Root MSE 7.38926 R-Square 0.7686 Dependent Mean 98.11321 Adj R-Sq 0.7641 Coeff Var 7.53136 Parameter Estimates Parameter Standard Variable DF Estimate Error t Value Pr > |t| Intercept 1 9.71949 6.86647 1.42 0.1630 owniq 1 0.90792 0.06975 13.02 <.0001
Why the awkward language?:Why not just say “increase” and “decrease”? 7 November 2005 Be careful about causal language! Read: Azar, B (2006) Discussing your findings. GradPsych 4(1) with much more to come in Unit 2
Plotting the fitted least squares regression line (120, 118.67) (80, 82.35) (97.36, 98.11) It’s wise to stay within the range of the sample data when graphing a line Estimate two fitted values: When X = 80: Ŷ=9.7195 + 0.9079 (80) = 82.35 When X = 120: Ŷ=9.7195 + 0.9079 (120) = 118.67 When X = 97.36: Ŷ=9.7195 + 0.9079 (97.36) = 98.11 Go to descriptive statistics
Four uses of the model and evaluating how well it achieves these goals Predicted values (ŷi) are estimated using the fitted line Description: Just as a mean summarizes the behavior of Y or X, the regression equation, which represents the mean of Y at each X, summarizes their relationship Explanation: The regression equation shows how X “explains” some of the variation in Y. Prediction: The regression equation allows us to predict Y—albeit imperfectly—if we have a given value of X Removing/controlling:Once we have a summary, we can remove it and see what’s left over—the residuals Residuals (yi - ŷi ) are the distances between the observed and predicted values for a given value of X • What benchmark might we use to evaluate how well the regression equation achieves these goals? • The least squares criterion identifies those parameter estimates that minimize the sum of the squared residuals • So we may ask how small did we get the residuals to be? The smaller they are, the better the fit • But…how do we evaluate whether the residuals are small, large, or something in between?
Meet Sir R. A. Fisher: One of the “fathers” of modern statistics(17 February 1890 – 29 July 1962) Credited with bringing statistics into practice with the publication of his accessible book… • Also initially a eugenicist. • In 1919, segued to doing agricultural research at Rothamsted Experimental Station • Popularized many modern statistical concepts and techniques including: • randomized trials, • degrees of freedom, • use of p-values for hypothesis testing Right now, we’re going to focus on one of his contributions, the Analysis of Variance, which helps us show how the relative size of the residuals helps us evaluate how well the regression line fits the data
Step 1: Let’s make sure we understand how to compute residuals:Vertical distances between observed values (yi) and fitted values (ŷi) Step 2: Calculate the residual = yi-ŷi Step 1: Compute ŷi by substituting OWNIQ into the regression equation Positive residuals: ID OwnIQ FostIQ yhat residual 1 68 63 71.459 -8.4586 2 71 76 74.182 1.8177 3 73 77 75.998 1.0019 4 75 72 77.814 -5.8139 5 78 71 80.538 -9.5376 ... 49 118 116 116.854 -0.8536 50 121 118 119.577 -1.5773 51 125 128 123.209 4.7911 52 129 117 126.841 -9.8405 53 131 132 128.656 3.3437 Under-predicted Negative residuals Over-predicted Sometimes we under-predict, sometimes we over-predict, but across the full sample, the residuals will always sum to 0 Conclusion: The FOSTIQ of ID 1 (the IQ of the child who was adopted) is 8.5 points lower than we would have predicted on the basis of his/her OWNIQ (the IQ of the child raised by the birth parents).
Step 2: To what might we compare the size of the residual?Let’s start with a single case….here, ID 46 • Two ways the ANOVA regression decomposition helps us evaluate the quality of the fit • Total deviations provide a context for evaluating the magnitude of the residuals • Instead of focusing on just the magnitude of the error deviations(the residuals) we can equivalentlyfocus on the magnitude of the regression deviations Error Deviation Total Deviation Regression Deviation The mean would be our “best guess” for all values of Y if we had no information about the regression model (ID 46: OWNIQ=114, FOSTIQ=125) • But…. • How do we generalize these ideas across cases? • How do we numerically make the comparison? = + ANOVA regression decomposition Total Dev Regr Dev Error Dev = +
Step 3: Let’s generalize and quantify these comparisonsThe general case of regression decomposition 2 2 Σ (Error Dev) Σ (Regress Dev) R2 = 2 2 Σ (Total Dev) Σ (Total Dev)
Analysis of Variance regression decomposition = 9251/12035 2 2 Analysis of Variance regression decomposition 2 and R2 The REG Procedure Model: MODEL1 Dependent Variable: fostiq Number of Observations Read 53 Number of Observations Used 53 Analysis of Variance Sum of Mean Source DF Squares Square F Value Pr > F Model 1 9250.65939 9250.65939 169.42 <.0001 Error 51 2784.66136 54.60120 Corrected Total 52 12035 Root MSE 7.38926 R-Square 0.7686 Dependent Mean 98.11321 Adj R-Sq 0.7641 Coeff Var 7.53136 Interpreting R2 76.9 percent of the variation in Foster Twin’s IQ scores is “associated with” or “predicted by” the IQ of the twin raised in the natural home. What about the remaining 23.1%? Measurement error Random error/Individual variation Other predictors (Environment, SES of household) 12035 = 9251 + 2785 Link here to a cool applet that helps you to play with and envision R-squared relationships
Notes on the interpretation of R2 • R2 says nothing about causality • Context in which you interpret the value of R2 depends upon your discipline (more in Unit 2) • R2 does not tell us about the appropriateness of straight lines nor the strength of nonlinear relationships (more in Units 4 and 5) • R2 is not a measure of the slope of the line (steep and shallow slopes can have low or high R2 statistics) (unless R2=0, in which case the slope will also be 0)
One last parameter to estimate: The residual variance, 2Y|X Y|x3 Y|x2 Y|x1 Does this numerator look familiar? Why do we subtract 1? Because we estimated 1 parameter (the mean) to estimate this other parameter (the variance) Of what importance is σ2Y|X? (the residual variance of Y at each value of X) Y 1. At each value of X, there is a distribution of Y. These distributions have a mean µY|X and a variance of σ2Y|X 3. Homoscedasticity.The variances of each of these distributions, the σ2Y|X’s are identical So σ2Y|X tells us about the variability of the residuals—the unexplained variability in Y that’s “left over” X … x1 x2 x3 How do we estimate variances? Let’s start by reviewing the sample variance of Y Analysis of Variance Sum of Mean Source DF Squares Square Model 1 9250.65939 9250.65939 Error 51 2784.66136 54.60120 Corrected Total 52 12035 Root MSE 7.38926 R-Square 0.7686 Dependent Mean 98.11321 Adj R-Sq 0.7641 Coeff Var 7.53136 = 231.4 So how does this help us estimate σ2Y|X?
From estimating 2Y to estimating 2Y|X Take away 2 because we estimated both 0 and 1 to estimate ŷ Mean Square Error (MSE) Does this concept of ‘penalizing’ our calculations for the number of parameters estimated have a name? Root Mean Square Error (RMSE) (the standard deviation of the residuals) Y X … x1 x2 x3 Analysis of Variance Sum of Mean Source DF Squares Square Model 1 9250.65939 9250.65939 Error 51 2784.66136 54.60120 Corrected Total 52 12035 Root MSE 7.38926 R-Square 0.7686 Dependent Mean 98.11321 Adj R-Sq 0.7641 Coeff Var 7.53136
Developing an understanding about degrees of freedom (df) ¾ -11.86 -3 .05 92 You are told that... What could the #s be? Examples Degrees of freedom • In regression, the degrees of freedom for a parameter estimate depend on: • the sample sizeAND • the # of other parameters you need to estimate in order to estimate thisparameter Imagine a random sample of 3 #s from an infinite population. The number of dfdepends on the number of constraints on their values 10, 20 & 30 200, -7, ⅞ -2.4, 86.8, 0 You have no constraints All numbers could be any number 3 The sample mean = 10 (i.e., 1 constraint) Two #s could be any #; the third is fixed 0 and 10 20 5 and 10 15 2 Sample mean = 10 and sample SD = 10 (i.e., 2 constraints) 10 0 & 20 0 10 & 20 One # could be anything; remaining two are fixed 1 … freedom decreases. As the constraints increase…
What’s the big takeaway from this unit? • The regression model represents your hypothesis about the population • When you fit a regression model to data, you are estimating sample values of population parameters that you’ll never actual calculate directly • Don’t confuse sample estimates with true values—estimates are just estimates, even if they have sound statistical properties • The regression model focuses on the average of Y at each given value of X. Individual variation figures prominently into the model through the error term (and residuals) • Be sure to fully understand the meaning of the regression coefficients • These are the building blocks for all further data analysis; take the time to make sure you have a complete and instinctual understanding of what they tell us • Distinguish clearly between the magnitude and strength of an effect—don’t confuse these separate concepts • The regression approach assumes linearity. We’ll learn in Units 4 and 5 how to evaluate these assumptions and what to do if they don’t hold • R2 is a nifty summary of how much the regression model helps us • Be careful about causal language—the phrase “explained by” does not imply causality • The regression decomposition, which leads to R2 and our estimate of the Root MSE (the residual standard deviation) will appear in subsequent calculations; be sure you understand what they do and do not mean
Appendix: Annotated PC SAS code for Unit 1, Burt data The optionsstatement specifies how you’d like the output to look—here eliminating dates, centering and page numbers The titleand footnotestatementsprovide text that will appear on the output; add as many as you like but always enclose the text in quotes Comments start with an asterisk * and can run over several lines (don’t forget the semicolon). Unlike titles and footnotes, they appear only in your program and log • The data step has (at least) three statements • The data statementreads raw data from an external file (here, Burt.txt) into a temporary SAS dataset (here called one). • The infile statement specifies the location of the raw data. Indicate appropriate drive where the file is stored (usually e: or f: for flash drive, etc) • The input statement specifies the variable names and their column locations in the raw data file proc printprints the newly created SAS data set (named “one”). The var statement identifies the variables you want printed; adding another title statement and id statement helps make the output more readable Every SAS statement ends with a semicolon ; options nodate nocenter nonumber; title1 "Unit 1: IQs of Cyril Burt's identical twins"; footnote1 "m:\SAS Programs\Unit 1--Burt analysis.sas"; *-----------------------------------------------------* Be sure to update the infile reference to the file's location on your computer *-----------------------------------------------------*; *-----------------------------------------------------* Input Burt data and name variables in dataset *-----------------------------------------------------*; data one; infile 'm:\datasets\Burt.txt'; input ID 1-2 OwnIQ 4-6 FostIQ 8-10; *-----------------------------------------------------* List owniq & fostiq data for entire Burt sample *-----------------------------------------------------*; proc print data=one; title2 "Data listing"; var owniq fostiq; id id; Continued on next page
Appendix: Annotated PC SAS code for Unit 1, Burt data, continued proc univariatepresents summary statistics (e.g., means, sd’s, stem-and-leaf displays). The var statement specifies the variables you want analyzed; the id statement provides identifiers for extreme values proc plotpresents a “line printer” scatterplot. The plot statement specifies the variables you want analyzed; the syntax is outcome*predictor proc gplotpresents a high quality scatterplot suitable for presentation. Its plot statement syntax is also outcome*predictor. If you don’t use a symbol statement, SAS will use + as a plotting symbol; here, we ask it to use a dot ● proc regfits a linear regression model using variables you specify. Its model statement syntax is outcome=predictor(s) (note the switch from an asterisk for the plots to an = for the model) The run statement tells SAS to execute the entire program; the quit statement tells SAS to stop execution proc univariate data=one plot; title2 "Descriptive statistics"; var fostiq owniq; id id; *---------------------------------------------------* Bivariate scatterplot of fostiq vs owniq using proc plot & proc gplot *---------------------------------------------------*; proc plot data=one; title2 "Line Printer plot of FostIQ vs OwnIQ"; plot fostiq*owniq; proc gplot data=one; title2 "High quality plot of FostIQ vs OwnIQ"; plot fostiq*owniq; symbol value=dot; *----------------------------------------------------* Fitting OLS regression model fostiq on owniq *------------------------------------------------- --*; proc reg data=one; title2 "Regression of FostIQ on OwnIQ"; model fostiq = owniq; run; quit;
Appendix: Relationships between Variance, MSE, and R2(on both squared and square root scales)
Appendix: Using Subscripts: Don’t be confused by the “i” • We use the subscript “i” to mean several things, depending on context: • any one of the observations; ID X Y 1 x1 y1 2 x2 y2 3 x3 y3 4 x4 y4 5 x5 y5 ... ID OwnIQ FostIQ 1 68 63 2 71 76 3 73 77 4 75 72 5 78 71 ... xi is a generic name for x1, x2, etc. yi is a generic name for y1, y2, etc. • 2. any one of the X values; Again, xi is a generic name for x1, x2, etc. | x3 | x4 | x1 | x2 | 30 | 40 | 10 | 20 • 3. more uses later in the semester.
Glossary terms included in Unit 1 • Assumptions of regression • Covariate • Degrees of freedom • Individual variation • Intercept • Least squares regression • Magnitude • Measurement error • MSE (mean square error) • Observed values and estimated values • Parameter estimates • Residual • R-squared • Slope • Strength