Download
1 / 25
250 likes | 321 Views
Programme of measures & cost-effectiveness Objective : identify the best combination of measures allowing to meet the environmental objective at the least cost Approach :

E N D
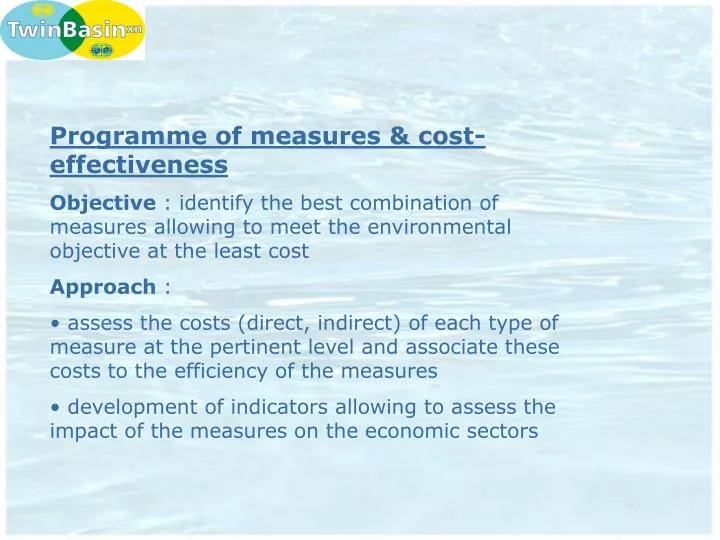
Programme of measures & cost-effectiveness • Objective : identify the best combination of measures allowing to meet the environmental objective at the least cost • Approach : • assess the costs (direct, indirect) of each type of measure at the pertinent level and associate these costs to the efficiency of the measures • development of indicators allowing to assess the impact of the measures on the economic sectors
Programme of measure & cost-benefit analysis • Objectif : justify the cost of the programme of measures regarding the benefits linked with the achievement of the environmental objective • Approach : • quick assessment of the programme of measures with potential disproportionate costs • assessment of benefits and avoided costs
Which measures to integrate in the cost-effectiveness analysis ? • mainly supplementary measures but the cost of the basic measures need to be assessed as well as its indirect effects Cost-effectiveness Indirect effects 2 Good status 3 1 Supplementary measures Basic measures Current status Basic measures Costs Basic measures 2015
Until 2006 work with the State sector only Step 1 : identify the potential measures for the French district Work made by the « Water Agency » this summer and organised by 6 themes: Households, industry, costal waters, habitat,diffuse pollutions, groundwater Step 2 : finish this first list , describe the measure in order to build a « catalogue of measures » for the district To have a reference book To have reference of prices To link measures and legislation Programme of measures - Progress
Basic or supplementary measure Measure involved in baseline scenario : Yes/No 6 kinds of measure : existing or new legislative instrument, financial instruments, « management » measure, awareness actions, research and development project, agreement actions, « economic » measure Legislation references Environmental oobjective among the 4 of the Directive Scale of application : water body or the whole district Costs : investment and running costs Direct expected impact Indirect expected impact Effectiveness : evaluate from 1 to 3 Difficulty : evaluate from 0 to 3 Catalogue items for each measure
Step 3 : the « territorial approach » scale of the work : one or more watershed scale of a measure : water body 1. Identify pressures on the territory and the links between pressures and the status of the water bodies 2. Identify the basic measures : add the supposed responsible and the supposed financial support 3. Evaluate their effects and the gap between the actual and the target situation 4. Identify necessary complementary measures : add the supposed responsible, the supposed financial support and the indirect avantages Programme of measures - Progress
A measure can have direct and/or indirect effects • qualitivative assessment • monetary valuation when it’s possible/pertinent • How to measure the efficiency of the measures ? • deal with uncertainty (studies, workshops) • set priorities for the implementation of the measures • How to identify the most cost-effective set of measures ? • a 3-steps approach
Etape 1 : identification of potential measures Etape 2 : set 2 or 3 strategies Etape 3 : set priorities and the implementation programme
A last illustration : building an indicator with water price and households’s available income
Water price survey • tariffs for water and sewerage set at municipality level (2 448 for the Artois-Picardie basin) • an annual survey is undertaken by the Artois-Picardie Water agency (i.e. collecting the price for water and sewerage for all municipalities for a mean consumption of 120m3 per year and per household) • this survey covers (in 2004) 95% of the basin’s population
Water price survey • one page questionnaire sent to municipalities, groups of municipalities, private operators every year • a feedback to all 2 448 municipalities through 4 pages results (mean water price for the basin, for sub-basin,…) • since 2004 survey, the data at municipality level can be found on the Artois-Picardie agency website
The breakdown of the 3,28 euros Water Distribution Sewerage Environmental Taxes Other taxes VAT
Assessment of household’s available income table 1 : Mean available income per household in all the sub-region of the Artois-Picardie Basin. Source : INSEE (National Statistics) + CEGMA TOPO
Comparison Water bill vis à vis available income Mean Water bill (all services) (price paid for 120m3 in a year) Mean available income per household Table 2 : comparison of the mean water invoice with mean available income per household
Comparison at municipality level Water Bill / Mean Available Income Less than 1% More than 3%
Results, limits and discussion • several groups of municipalities with ratio>3% (2-3% is a guidance value – see OCDE, EU, Académie de l’eau) • these groups of municipalities combine high water price and low mean available income (and sometimes household’s expenses to buy bottled water equivalent to annual water bill)
Results, limits and discussion • the commonly used value of annual consumption of 120 m3 per household hides important differences of mean consumption per region • mean available income per municipality hides also various situations (and the real part of the population facing major difficulties to pay water bills)
Results, limits and discussion • what to do ? Continue ! Refine this ratio and continue to track it in the coming years • pay a specific attention to the groups of municipalities where efforts to meet WFD objectives should lead to major increase in water price (extent solidarity principle, delay or less stringent objectives ?) • it raises this issue of specific social tariffs (e.g. Flanders’ experience, blocks tariffs, development of water savings, renew confidence in tap water)
Environmental Objective Cost-benefit analysis Don’t worry, be happy ! …..and thanks for your attention ! Cost-effectivness analysis Cost