Download
1 / 13
140 likes | 418 Views
Example: Theories in Public Policy Process. Modeling Public Policy Competing Theories of the Policy Process What are Models? Models are based on theory. A theory is a set of logically related set of statements, including some law like generalizations, that are empirically testable.

E N D
Modeling Public Policy Competing Theories of the Policy Process What are Models? Models are based on theory. A theory is a set of logically related set of statements, including some law like generalizations, that are empirically testable.
How do we know if models or theories are useful or helpful? Order and simplify reality Models help identify what is significant. Models should be congruent with reality. Models should provide meaningful communication. Models should suggest explanations. Models should direct inquiry and research.
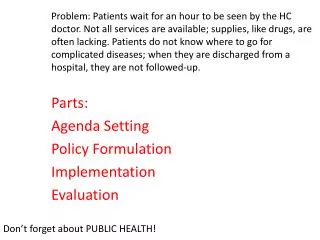
where should we look when studying policy? Theories and models help us answer this question Day to day decisionmaking Statutory language Policy outcomes/effects Individuals Institutions Groups Elite
(neo)Institutional Rationalism Incrementalism Punctuated Equalibrium Group/Pluralism Elite Public Choice Game theory Systems theory Stages Approach
Schutt Examples • Functionalism • Conflict Theory • Rational Choice • Symbolic Interaction
What is your research philosophy? What is the difference between Positivism and Post-Positivism?
Descriptive: Central Tendency • Mode - The most frequent observation. Usually used with nominal data to describe data. Limitation - limited information - could be multi-modal. Cannot be arithmetically manipulated • Median - the middle observation. Usually used with ordinal level data. Relatively stable. Limitations - must have ordinal data or higher. Cannot be arithmetically manipulated • Mean - Most widely used measure in statistics (i.e., most statistical tests are built around the mean). Can be arithmetically manipulated (calculated). Limitations - must have either interval or ration data, sensitive to outliers Formula: ∑x / n
Measures of Variability or Dispersion Range - high and lows. • Limitations: Based on only two extreme observations Interquartile range - measures variablility based on percentiles. Q3(75th percentile) -Q1 (25th percentile) Limitations: Leaves our many observations Mean Deviation – the average of the absolute deviations. ∑|x-µ| / n Limitations: Less sensitive to deviations in the distribution Variance - Based on distances from the mean (X - mean). Takes the square of each deviation from the average and then averages the squares. ∑(x-µ)2 / n StandardDeviation - the square root of the variance
Why Do We Want a Measure of Variation? Which is the Better Measure of Variation? Why do we Square the difference from the mean? Why do we take the square root of the Variance? How do we interpret the Standard Deviation