Download
1 / 28
280 likes | 407 Views
RHESSI Spectroscopy of Thermal Solar Flare X-ray Emission . Cristina Chifor (a) Ken Phillips (b) , Brian Dennis (c) DAMTP, University of Cambridge, UK Mullard Space Science Lab, UK NASA/GSFC, Maryland, USA.

E N D
RHESSI Spectroscopy of Thermal Solar Flare X-ray Emission Cristina Chifor (a) Ken Phillips (b) , Brian Dennis (c) • DAMTP, University of Cambridge, UK • Mullard Space Science Lab, UK • NASA/GSFC, Maryland, USA ‘X-ray Spectroscopy and Plasma Diagnostics From the RHESSI,RESIK and SPIRIT Instruments’ 6-8 December 2005 Wroclaw, Poland
Presentation Outline • Reuven Ramaty High Energy Solar Spectroscopic Imager: Data Access and Analysis • Fe Line Complexes : Observations with RHESSI • RHESSI / RESIK Cross - Calibration • How to get more help with RHESSI data & analysis
RHESSIReuven Ramaty High Energy Solar Spectroscopic Imager NASA Small Explorer Imaging and spectroscopic observations of solar flares since February 5th, 2002 Principal Investigator: Robert Lin, UCB Lead Co-investigator: Brian Dennis, NASA/GSFC
RHESSIReuven Ramaty High Energy Solar Spectroscopic Imager 9 cylindrical cooled Ge detectors (< 75 K) Energy range: 5 keV to 17 MeV (~ 8 mÅto 2.5 Å) FWHM ~1 keV (12.4 Å) in the “soft” X-ray range (“soft” ~ up to 20 keV) Movable shutters, high-rate electronics with “pile-up” suppression
How to Access RHESSI Data ? Object Oriented Software & GUI Distributed through the Solar Software package SSWIDL (hessi) http://hesperia.gsfc.nasa.gov/ssw/hessi/doc/ hessi_data_access.htm RHESSI DATA: • Flare catalogue • “Quicklook” plots • Level 0 Telemetry Data
RHESSI Data I: Flare Catalogue Up to date text and binary FITS file Currently, containing more than 18,000 flares INCLUDING…: FLARE CATALOGUE NO. START, PEAK & END TIMES DURATION PEAK COUNT FLUX (C/S) ENERGY RANGE X, Y COORDINATES (ARCSEC) FLAGS (i.e attenuator state, night-time, SAA )
RHESSI Data II: « Quicklook » Daily FITS files in the metadata/catalogue directory of the RHESSI data archive
RHESSI Data III: Level 0 Telemetry Data Packets in FITS files (up to ~ 110 Mb) One FITS file/single orbit between local midnights Multiple FITS files for large flares http://hesperia.gsfc.nasa.gov/hessidata/ GSFC (Maryland) ftp://hercules.ethz.ch/pub/hessi/data ETH (Switzerland)
Spectral Analysis Overview I STEP 1. Generate count rate spectra. hessi -> RHESSI GUI OUTPUT: Count spectrum file + Response Matrix (srm) file
Spectral Analysis Overview II STEP 2.OSPEX. Obtain photon spectra + models. obj = ospex() INPUT: Count spectrum file + Response Matrix (srm) file Until recently, used MEWE spectral model. Now changed to CHIANTI.
"RHESSI Observations of the Iron - Line Feature at 6.7 keV”, Phillips, K. J. H., Chifor, C. , Dennis, B. • submitted to the Astrophys. J Motivation • RHESSI observes both continuum and Fe line complexes (at 6.7 keV and 8 keV) • How does the empirical Fe/H abundance ratio in flares vary with Te ? • How do empirical correlation curves compare with theoretical curves calculated with coronal Fe abundances ?
Flare Sampling Criteria • Isothermal approximation OK in the late decay stages • So, choose long duration, slowly decaying flares • Used GOES to select flares according to this criteria Example: GOES fluxes, high-energy band (~ 25 keV) lightcurves for July 2002
Sampled Flares • 30 flares between 2002 - 2005 • GOES X-ray classification: C3 – X8 • More than 2000 spectra of 20 – 60 s in the decaying stages of these flares
Spectral Modeling • RHESSI GUI: spectral file + SRM file Energy bins: 1/3 keV in the 3 - 20 keV range 1 keV in the 20 – 100 keV range Time bins: 20 – 60 s Optional pulse pile-up corrections ( rate > 1000 counts/s) • Input the2 files in the Object Spectral Executive (OSPEX) Background subtraction One isothermalcomponentto fit continuum + 2 Gaussianlines (1 keV FWHM) centered at ~ 6.7 and 8 keV to model the Fe and Fe/Ni complexes Reduced chi-squared for best fit
Some Instrumental Issues • High count rates in RHESSI detectors decrease energy resolution in the soft X-ray range and increase calculated T. • “pulse pile-up” problems at high count rates • Therefore, for now, avoid A0 attenuator states (i.e. when no shutters are in front of detectors)
Chianti 5.0 Coronal abundances
Fe Line Complexes: Summary & Conclusions • Survey of > 30 RHESSI flares (GOES class C3 - X5) • Fe line features observed by RHESSI at 6.7 keV indicate a coronal abundance of Fe for the emitting flare plasma. • Some differences between the observed and theoretical EW’s of the lines may be due to: • Non-isothermalnature of the flare plasma (in particular at and shortly after the flare peak) • Instrumentaleffects such as the resolving of the line features at high count rates • Possibleerrorsinatomicrates used in theoretical He-like Fe ion fractions.
RHESSI vs. RESIK A number of coincident flares: cross-calibration possible. RHESSI low energy end ~5 keV RESIK in 1st -order mode observes from 2.0 to 3.7 keV RESIK in 3rd–order mode sees Fe line feature at 6.7 keV
Getting Help I: RHESSI Home Page http://hesperia.gsfc.nasa.gov/
Getting Help II: Data & Software Center http://hesperia.gsfc.nasa.gov/rhessidatacenter/
RHESSI Nuggets http://sprg.ssl.berkeley.edu/~tohban/nuggets/
Thank you ! Thank You !
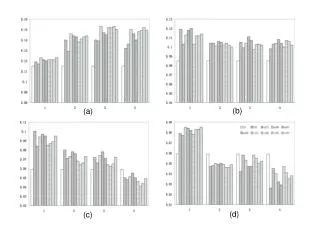
Fe Line Complexes: RHESSI Observations Counts/s/cm2/keV