Download
1 / 1

E N D
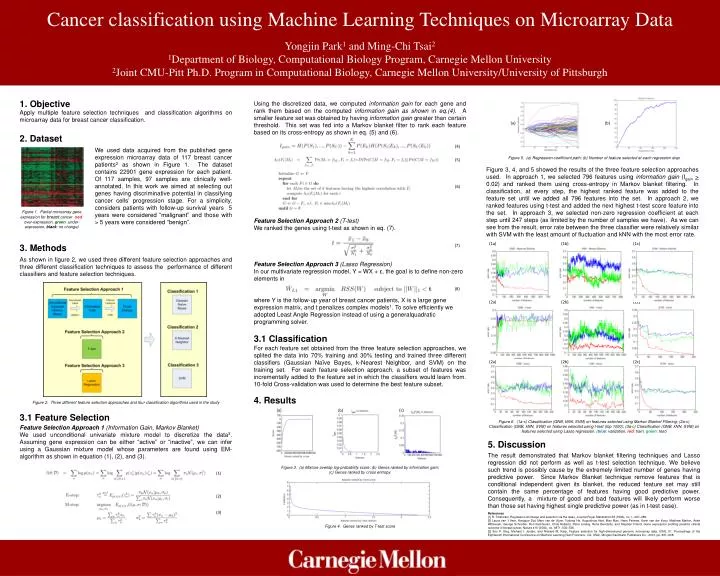
1. Objective Using the discretized data, we computed information gain for each gene and rank them based on the computed information gain as shown in eq.(4). A smaller feature set was obtained by having information gain greater than certain threshold. This set was fed into a Markov blanket filter to rank each feature based on its cross-entropy as shown in eq. (5) and (6). Apply multiple feature selection techniques and classification algorithms on microarray data for breast cancer classification. 2. Dataset (4) We used data acquired from the published gene expression microarray data of 117 breast cancer patients2 as shown in Figure 1. The dataset contains 22901 gene expression for each patient. Of 117 samples, 97 samples are clinically well-annotated. In this work we aimed at selecting out genes having discriminative potential in classifying cancer cells’ progression stage. For a simplicity, considers patients with follow-up survival years 5 years were considered “malignant” and those with > 5 years were considered “benign”. Figure 5. (a) Regression coefficient path; (b) Number of feature selected at each regression step (5) Figure 3, 4, and 5 showed the results of the three feature selection approaches used. In approach 1, we selected 796 features using information gain (Igain> 0.02) and ranked them using cross-entropy in Markov blanket filtering. In classification, at every step, the highest ranked feature was added to the feature set until we added all 796 features into the set. In approach 2, we ranked features using t-test and added the next highest t-test score feature into the set. In approach 3, we selected non-zero regression coefficient at each step until 247 steps (as limited by the number of samples we have). As we can see from the result, error rate between the three classifier were relatively similar with SVM with the least amount of fluctuation and kNN with the most error rate. Cancer classification using Machine Learning Techniques on Microarray DataYongjin Park1 and Ming-Chi Tsai21Department of Biology, Computational Biology Program, Carnegie Mellon University2Joint CMU-Pitt Ph.D. Program in Computational Biology, Carnegie Mellon University/University of Pittsburgh (6) (a) (b) Figure 1. Partial microarray gene expression for breast cancer (red: over-expression, green: under-expression, black: no change) Feature Selection Approach 2 (T-test) We ranked the genes using t-test as shown in eq. (7). (1a) (1b) (1c) 3. Methods (7) As shown in figure 2, we used three different feature selection approaches and three different classification techniques to assess the performance of different classifiers and feature selection techniques. Feature Selection Approach 3 (Lasso Regression) In our multivariate regression model, Y = WX + ε, the goal is to define non-zero elements in where Y is the follow-up year of breast cancer patients, X is a large gene expression matrix, and t penalizes complex models1. To solve efficiently we adopted Least Angle Regression instead of using a generalquadratic programming solver. (8) (2a) (2b) (2c) 3.1 Classification For each feature set obtained from the three feature selection approaches, we splited the data into 70% training and 30% testing and trained three different classifiers (Gaussian Naïve Bayes, k-Nearest Neighbor, and SVM) on the training set. For each feature selection approach, a subset of features was incrementally added to the feature set in which the classifiers would learn from. 10-fold Cross-validation was used to determine the best feature subset. (2a) (2b) (2c) 4. Results Figure 2. Three different feature selection approaches and four classification algorithms used in the study 3.1 Feature Selection Figure 6. (1a-c) Classification (GNB, kNN, SVM) on features selected using Markov Blanket Filtering; (2a-c) Classification (GNB, kNN, SVM) on features selected using t-test (top 1000); (3a-c) Classification (GNB, kNN, SVM) on features selected using Lasso regression. (blue: validation, red: train, green: test) Feature Selection Approach 1 (Information Gain, Markov Blanket) We used unconditional univariate mixture model to discretize the data3. Assuming gene expression can be either “active” or “inactive”, we can infer using a Gaussian mixture model whose parameters are found using EM-algorithm as shown in equation (1), (2), and (3). 5. Discussion The result demonstrated that Markov blanket filtering techniques and Lasso regression did not perform as well as t-test selection technique. We believe such trend is possibly cause by the extremely limited number of genes having predictive power. Since Markov Blanket technique remove features that is conditional independent given its blanket, the reduced feature set may still contain the same percentage of features having good predictive power. Consequently, a mixture of good and bad features will likely perform worse than those set having highest single predictive power (as in t-test case). (a) (c) (b) Figure 3. (a) Mixture overlap log-probability score; (b) Genes ranked by information gain; (c) Genes ranked by cross entropy. (1) (2) (3) References [1] R. Tibshirani, Regression shrinkage and selection via the lasso, Journal Royal Statististics 58 (1994), no. 1, 267–288. [2] Laura van ’t Veer, Hongyue Dai, Marc van de Vijver, Yudong He, Augustinus Hart, Mao Mao, Hans Peterse, Karin van der Kooy, Matthew Marton, Anke Witteveen, George Schreiber, Ron Kerkhoven, Chris Roberts, Peter Linsley, Rene Bernards, and Stephen Friend, Gene expression profiling predicts clinical outcome of breast cancer, Nature 415 (2002), no. 6871, 530–536. [3] Eric P. Xing, Michael I. Jordan, and Richard M. Karp, Feature selection for high-dimensional genomic microarray data, ICML ’01: Proceedings of the Eighteenth International Conference on Machine Learning (San Francisco, CA, USA), Morgan Kaufmann Publishers Inc., 2001, pp. 601–608. Figure 4. Genes ranked by T-test score