Download
1 / 1
10 likes | 89 Views
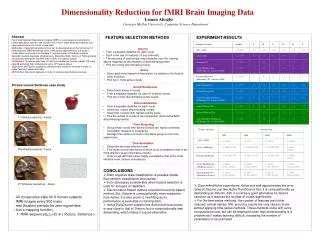
Learn how aliasing affects brain imaging, sampled from gray matter and pial surface, impacting brain activation analysis and data interpretation. Gain insights on detecting and mitigating aliasing errors in volumetric grid sampling for accurate results.

E N D
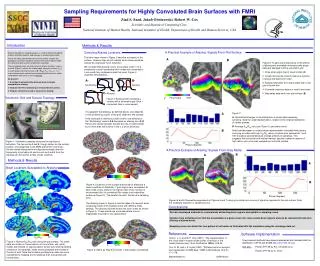
Detecting Aliased Locations A Practical Example of Aliasing: Signals From Gray Matter A Practical Example of Aliasing: Signals From Pial Surface The ratio maps shown in Figure 2 describe a property of the surface. However they do not indicate which areas would be aliased at a particular voxel resolution. We consider that aliasing occurs at a surface node n if it is sampled by a voxel containing other nodes not connected to n via a path fully contained inside that voxel. Figure 3 illustrates this definition. A- No Aliasing B- Aliasing C-Aliasing Polar Angle 1800 o0 Figure 3: Aliasing when sampling a surface with a volumetric grid. Blue = connected, Red = unconnected. It is apparent that aliasing, as defined above, also depends on the positioning (origin) of the grid, relative to the surface. If the voxel grid is moved by a half voxel in one dimension, the “No Aliasing” case in 3-A becomes an aliasing one (3-C). Hence one should consider the grid at a set of origins offset by no more than half a voxel in the x, y and z directions. B A 0 0 1 1 Nu/Nc Nu/Nc Figure 4: Locations on the surface that would be aliased at a voxel resolution of 4x4x4mm. 7 grid origins were considered. At each node, colors code for the highest ratio of the number of unconnected (Nu) to connected (Nc) nodes (red nodes/blue nodes per Figure 3). The smaller the ratio, the less the sampling error. The aliasing shown in Figure 4 must be taken into account when comparing results from multiple scans with differing origin settings. The aliasing incurred at any one scan is less as shown in Figure 5. These results are more descriptive of error magnitudes incurred for one grid position. References SAB/RAB 20+ 1 Figure 5: Same as Figure 4 but with 1 grid position considered. Sampling Requirements for Highly Convoluted Brain Surfaces with FMRI Ziad S. Saad, Jakub Otwinowski, Robert W. Cox Scientific and Statistical Computing Core. National Institute of Mental Health, National Institutes of Health, Department of Health and Human Services, USA Introduction Methods & Results Surface-based brain imaging analysis is used for detailed mapping of brain activation patterns and changes in cerebral gray matter. Due to the highly convoluted nature of the cortical surface, the topology of activation along the cortical sheet can be obscured by the volumetric grid used to sample brain activation. These sampling errors are likely to occur at brain locations such as A and B (Figure 1) where the shortest path along the surface (SAB) is much longer than the distance in R3 (RAB): SAB / RAB >> 1. In such instances brain activity from functionally distinct areas will be sampled with one voxel (a sort of aliasing). We present : 1- A method to automatically delineate brain locations susceptible to aliasing 2- Illustrate the effect of aliasing on measured brain activity 3- Propose methods to avoid or account for aliasing A B Figure 6: To gain a practical sense of the effects of aliasing we simulated retinotopic polar angle data and sampled it with a volumetric grid 1- Draw polar angle map in visual cortex (A) 2- Create time series at each node as a function of phase and add some noise 3- Sample timeseries from pial surface with voxel grid of 4x4x4 mm 4- Compute response delays in voxel time series 5- Map delay data back onto pial surface (B) Volumetric Grid and Surface Topology Figure 7: A- Normalized changes in the distribution of phase data caused by sampling. Note the underrepresentation, relative to the original distribution, of certain phases. B- Average Sab/Rab ratio (see Figure 1) per phase value. Note how decreases in certain phase representation coincided with phases occurring at nodes with high Sab/Rab ratios. (extreme bins centered at 1 and 180 should be ignored because of edge artifacts of sampling). This suggests that horizontal and vertical meridia, typically located in regions of high ratios, are not as well sampled as horizontal meridia. A B Figure 1: Volumetric sampling obscures the topology of activation. The two points A and B, though distant on the cortical surface, are juxtaposed in the FMRI grid (4mm voxel size). Volume-based interpolation will disproportionately alter the topography of activation at points such as A and B from the topology at other points at less crucial locations. Phase (degrees) B A Methods & Results A Brain Locations Susceptible to Aliasing B Phase (degrees) Figures 8 and 9: Respective equivalents of Figures 6 and 7 using gray matter as a source of signal as opposed to the pial surface. Note the moderate reduction in sampling errors. Conclusions We have developed methods for automatically delineating brain regions susceptible to sampling errors. Variance from sampling errors that are unavoidable at a given voxel size varies across brain regions and can be reduced with selective filtering at aliased areas. Sampling errors can distort the true pattern of activation as illustrated with the simulation using the retinotopy data set. Software Implementation Horton, J. C. and W. F. Hoyt (1991). "The representation of the visual field in human striate cortex. A revision of the classic Holmes map." Arch Ophthalmol 109(6): 816-24. Cox, R. W. and J. S. Hyde (1997). "Software tools for analysis and visualization of fMRI data." NMR in Biomedicine 10(4-5): 171-178. Reprint Requests: ziad@nih.gov The proposed methods have been implemented and included with the distribution of AFNI and SUMA http://afni.nimh.nih.gov See also: Poster # PT-49 by P.C. Christidis et al. Poster # PT-50 by G. Chen Figure 2: Highest SAB/RAB ratio along the pial surface. The same data are shown on three versions of the surface: pial, white matter and inflated, to expose data in buried sulci while facilitating orientation. As expected, areas most susceptible are located on the lips of sulci. Note that occipital and temporal lobes are more susceptible to mapping errors (aliasing) than the parietal and frontal lobes.