Download
1 / 22
230 likes | 454 Views
Progress Toward Satisfying the Aqua Mission Success Criteria. Claire L. Parkinson Aqua Project Scientist Aqua Briefing NASA Headquarters August 7, 2006. Aqua Mission Success Criteria. Produce the first high spectral resolution global infrared spectra of the Earth.

E N D
Progress Toward Satisfying the Aqua Mission Success Criteria Claire L. Parkinson Aqua Project Scientist Aqua Briefing NASA Headquarters August 7, 2006
Aqua Mission Success Criteria Produce the first high spectral resolution global infrared spectra of the Earth. Obtain a highly accurate temperature profile of the troposphere. Extend the improved TRMM rainfall characterization to the extra tropics. Produce the first global sea surface temperature daily maps under nearly all sky conditions for a minimum of 1 year. Produce large-scale global soil moisture distribution for regions with low vegetation. Produce calibrated global observations of the Earth’s continents and ocean surfaces. Capture and document two seasonal cycles of terrestrial and marine ecosystems and atmospheric and cloud properties. Produce two seasonal/annual Earth radiation budget records. Produce improved measurements of the diurnal cycle of radiation by combining Aqua and Terra measurements. Produce combined cloud property and radiation balance data to allow improved studies of the role of clouds in the climate system.
1. Produce the first high spectral resolution global infrared spectra of the Earth. Status: This was accomplished by the AIRS Science Team in October 2002. Sample AIRS infrared spectrum, showing all 2378 AIRS infrared channels for one footprint off the west coast of South Africa, June 13, 2002, 1:30 UTC. Brightness Temperature (K) 500 1000 1500 2000 2500 wavenumber (cm-1) 20 10 6.7 5 4 wavelength (m) (spectrum from Mous Chahine and the AIRS Science Team)
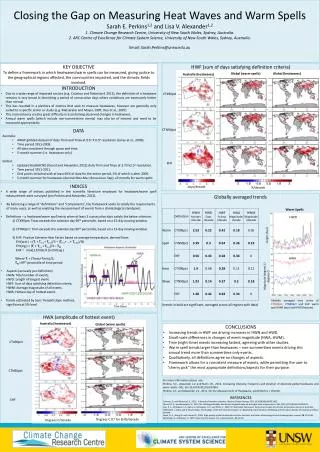
2. Obtain a highly accurate temperature profile of the troposphere. Status: This has been accomplished by the AIRS Science Team for non-polar regions (ocean and land areas) and is expected to be accomplished for the polar regions by the end of December 2006. Global Temperature Profile Accuracies vs. Radiosondes, 9/2002 - 12/2004 Individual AIRS Temperature Profile over the Chesapeake Bay (smooth curve) vs. a Radiosonde Profile (more jagged curve), for 9/13/2002 Pressure (mb) Temperature (K) Temperature RMS (K) (plots from Wallace McMillan [left] and Murty Divakarla [right], obtained through Tom Pagano and Mous Chahine)
3. Extend the improved TRMM rainfall characterization to the extra tropics. Status: This was accomplished by the AMSR-E Science Team in November 2002. Details: Not only the patterns but the magnitudes of the AMSR-E and TRMM Microwave Imager (TMI) results match very closely. See the sample images, for October 2005, on the next slide.
Aqua AMSR-E October 2005 Rainfall TRMM Microwave Imager (TMI) October 2005 Rainfall (images from Chris Kummerow and Ralph Ferraro, through Elena Lobl)
4. Produce the first global sea surface temperature daily maps under nearly all sky conditions for a minimum of 1 year. Status: This was accomplished by the AMSR-E Science Team in December 2003. Details: The AMSR-E Science Team has now produced over four years of global sea surface temperature (SST) maps. These are available as daily ascending and descending images and as 3-day, weekly, and monthly average images. The next slide shows a sample pair of daily maps, and the following slide shows seasonal mid-month 3-day averages for 2005.
Sample Aqua AMSR-E Daily Sea Surface Temperature Images August 1, 2006, ascending passes August 1, 2006, descending passes (images from Frank Wentz’s www.remss.com website)
Aqua AMSR-E Seasonal Sea Surface Temperature 3-Day Images, 2005 March 15-17, 2005 June 15-17, 2005 September 15-17, 2005 December 15-17, 2005 (images from Frank Wentz’s www.remss.com website)
5. Produce large-scale global soil moisture distribution for regions with low vegetation. Status: This was accomplished by the AMSR-E Science Team, as demonstrated below. November 2002 volumetric soil moisture (%) (top 1 cm of the surface) (image from Eni Njoku)
6. Produce calibrated global observations of the Earth’s continents and ocean surfaces. Status: This was accomplished by the MODIS Science Team. Land sample: July 2004 enhanced vegetation index Ocean sample: July 2004 sea surface temperatures 0.0 0.2 0.4 0.6 0.8 1.0 Enhanced vegetation index (EVI) Sea surface temperature (SST, C) (images from Vince Salomonson, from the MODIS website)
7. Capture and document two seasonal cycles of terrestrial and marine ecosystems and atmospheric and cloud properties. Status: This was accomplished by the MODIS Science Team. Details: By now, the MODIS Science Team has produced four seasonal cycles of approximately 40 global products. The next three slides illustrate two seasonal cycles for six variables, showing global January, April, July, and October data for 2004 and 2005 for (1) land surface reflectance and enhanced vegetation index, (2) sea surface temperature and chlorophyll, and (3) aerosol optical depth and cloud optical thickness.
Aqua MODIS Surface Reflectance and Enhanced Vegetation Index, 2004 and 2005 SFC REFL EVI SFC REFL EVI JULY 2004 JANUARY 2004 JULY 2004 JANUARY 2004 JANUARY 2005 JANUARY 2005 JULY 2005 JULY 2005 APRIL 2004 APRIL 2004 OCTOBER 2004 OCTOBER 2004 APRIL 2005 APRIL 2005 OCTOBER 2005 OCTOBER 2005 (images from Vince Salomonson, from the MODIS website)
Aqua MODIS Sea Surface Temperature and Chlorophyll, 2004 and 2005 CHLOROPHYLL SST SST CHLOROPHYLL JANUARY 2004 JANUARY 2004 JULY 2004 JULY 2004 JANUARY 2005 JANUARY 2005 JULY 2005 JULY 2005 APRIL 2004 APRIL 2004 OCTOBER 2004 OCTOBER 2004 APRIL 2005 APRIL 2005 OCTOBER 2005 OCTOBER 2005 (images from Vince Salomonson, from the MODIS website)
Aqua MODIS Aerosol and Cloud Optical Thickness, 2004 and 2005 AEROSOLS CLOUDS AEROSOLS CLOUDS JANUARY 2004 JANUARY 2004 JULY 2004 JULY 2004 JANUARY 2005 JANUARY 2005 JULY 2005 JULY 2005 APRIL 2004 APRIL 2004 OCTOBER 2004 OCTOBER 2004 APRIL 2005 OCTOBER 2005 OCTOBER 2005 APRIL 2005 (images from Vince Salomonson, from the MODIS website)
8. Produce two seasonal/annual Earth radiation budget records. Status: This has been accomplished by the CERES Science Team for ERBE-like radiative fluxes, Levels 1-3, and for Levels 1-2 of the more advanced data products. It is expected to be accomplished for Level 3 of the more advanced products by December 2007 (some by December 2006). Details: Several validated Level 1, 2, and 3 Aqua CERES data products have been produced through December 2005, providing a 3.5-year record that is archived and publicly available. These products include Level 1b radiances, Level 2 and 3 ERBE-like top of the atmosphere (TOA) fluxes, Level 2 field of view CERES single scanner TOA and surface fluxes and clouds (combining CERES data with MODIS and other data), and Level 3 instantaneous 1-degree gridded TOA and surface fluxes and clouds.
256 128 0 350 250 150 Sample ERBE-Like Level 3 Global Images of Outgoing Shortwave and Longwave Radiation from the Aqua CERES, for June 22, 2002 Reflected shortwave radiation (W m-2) Outgoing longwave radiation (W m-2) (images from the CERES Science Team)
9. Produce improved measurements of the diurnal cycle of radiation by combining Aqua and Terra measurements. Status: This has been accomplished by the CERES Science Team for the ERBE-like top-of-the-atmosphere data products and should be accomplished for the advanced Level 3 data products by the end of 2008. Details: This criterion has been satisfied for Levels 1, 2, and 3 of the ERBE-like combined Aqua and Terra products. For higher level fusion products, several consistency tests have been done, and full fusion (cloud/aerosol/radiation) Level 3 combined Terra/Aqua data products should be produced for the CERES surface average products (SRBAVG) in 2007 and for the synoptic radiative fluxes and cloud products (SYN) in 2008.
Net flux difference (Aqua-Terra) Shortwave flux difference (Aqua-Terra) Sample Diurnal Cycle Information Obtained by Combining Aqua and Terra CERES Data, showing top of the atmosphere flux differences for July 2002 - June 2003 (images from Tak Wong, Norm Loeb, and the CERES Science Team)
10. Produce combined cloud property and radiation balance data to allow improved studies of the role of clouds in the climate system. Status: The CERES Science Team has succeeded in creating a 3.5-year Level 2 data product that combines Aqua CERES top-of-the-atmosphere fluxes and surface flux estimates with (a) aerosol and cloud properties from MODIS, (b) temperature/humidity/wind profiles from the Goddard Earth Observation System (GEOS) version 4.0.3, (c) snow and sea-ice maps from MODIS and Special Sensor Microwave Imager (SSMI) measurements, (d) surface cover maps from the International Geosphere-Biosphere Program (IGBP), and (e) aerosol assimilation products from the National Center for Atmospheric Research (NCAR). However, a sequence of further improvements and additions is planned, with the anticipation that Criterion 10 will be fully satisfied in 2008.
Sample Comparison of Aqua CERES Radiative Data and Aqua MODIS Cloud Property Data,showing CERES shortwave top-of-the-atmosphere flux anomalies and MODIS cloud fraction anomalies for mid-2002 through early 2005 (plots from Norm Loeb, Bruce Wielicki, and the CERES Science Team)