Download
1 / 1
10 likes | 87 Views
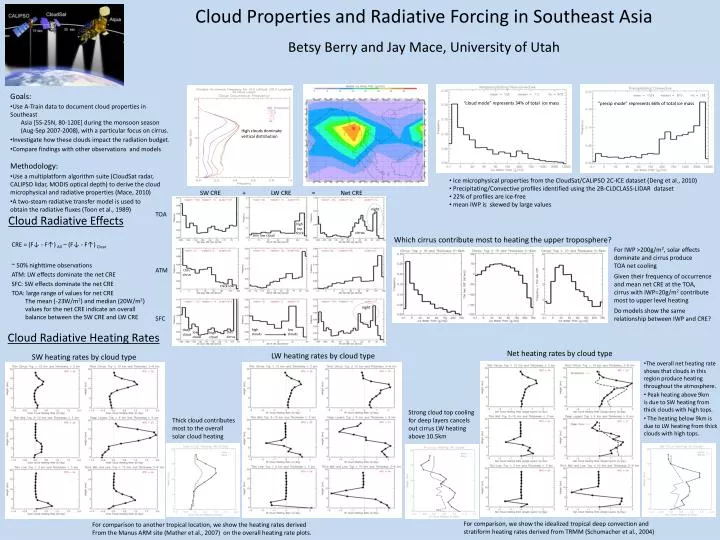
Cloud Properties and Radiative Forcing in Southeast Asia Betsy Berry and Jay Mace, University of Utah. Goals: Use A-Train data to document cloud properties in Southeast Asia [5S-25N, 80-120E] during the monsoon season

E N D
Cloud Properties and Radiative Forcing in Southeast AsiaBetsy Berry and Jay Mace, University of Utah • Goals: • Use A-Train data to document cloud properties in Southeast • Asia [5S-25N, 80-120E] during the monsoon season • (Aug-Sep 2007-2008), with a particular focus on cirrus. • Investigate how these clouds impact the radiation budget. • Compare findings with other observations and models • Methodology: • Use a multiplatform algorithm suite (CloudSat radar, CALIPSO lidar, MODIS optical depth) to derive the cloud microphysical and radiative properties (Mace, 2010) • A two-steam radiative transfer model is used to • obtain the radiative fluxes (Toon et al., 1989) “cloud mode” represents 34% of total ice mass “precip mode” represents 66% of total ice mass High clouds dominate vertical distribution • Ice microphysical properties from the CloudSat/CALIPSO 2C-ICE dataset (Deng et al., 2010) • Precipitating/Convective profiles identified using the 2B-CLDCLASS-LIDAR dataset • 22% of profiles are ice-free • mean IWP is skewed by large values SW CRE + LW CRE = Net CRE night TOA ATM SFC Cloud Radiative Effects high top thick cirrus thin low cloud Which cirrus contribute most to heating the upper troposphere? CRE = (F↓ - F↑) All – (F↓ - F↑) Clear For IWP >200g/m2, solar effects dominate and cirrus produce TOA net cooling Given their frequency of occurrence and mean net CRE at the TOA, cirrus with IWP=20g/m2 contribute most to upper level heating Do models show the same relationship between IWP and CRE? ~ 50% nighttime observations ATM: LW effects dominate the net CRE SFC: SW effects dominate the net CRE TOA: large range of values for net CRE The mean (-23W/m2) and median (20W/m2) values for the net CRE indicate an overall balance between the SW CRE and LW CRE thin cirrus thick low night high low clouds clouds deep cloud Cloud Radiative Heating Rates low cloud thin cirrus high cloud Net heating rates by cloud type LW heating rates by cloud type SW heating rates by cloud type • The overall net heating rate shows that clouds in this region produce heating throughout the atmosphere. • Peak heating above 9km • is due to SW heating from thick clouds with high tops. • The heating below 9km is due to LW heating from thick clouds with high tops. Strong cloud top cooling for deep layers cancels out cirrus LW heating above 10.5km Thick cloud contributes most to the overall solar cloud heating For comparison, we show the idealized tropical deep convection and stratiform heating rates derived from TRMM (Schumacher et al., 2004) For comparison to another tropical location, we show the heating rates derived From the Manus ARM site (Mather et al., 2007) on the overall heating rate plots.