Download
1 / 8
90 likes | 596 Views
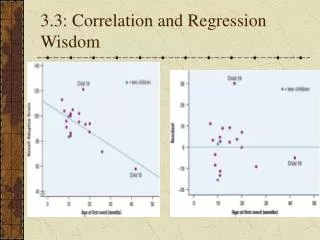
Chapter 9 Regression Wisdom. Subsets If the data consist of two or more groups that have been thrown together, it is usually best to fit different linear models to each group than to try to fit a single model to all the data Residuals Plot Extrapolation

E N D
Chapter 9Regression Wisdom • Subsets • If the data consist of two or more groups that have been thrown together, it is usually best to fit different linear models to each group than to try to fit a single model to all the data • Residuals Plot • Extrapolation • It is unsafe to predict values of y for values of x that are far from the ones used to find the linear model equation. Extrapolation in time is particulary dangerous.
y x OUTLIERS • x-outiers • y-outliers • Model Outliers y x y x
y x Outliers (cont.) • High Leverage Points • (x-outliers) • Influential Points • High Leverage Points that are model outliers y x
Project • Make sure the relationship is straight. • Check Residuals • Beware of extrapolating • Careful extrapolating into the future. • Check for subsets (different groups) • Look for outliers • Beware of high leverage points and specially of those that are influential. • Consider comparing two regressions • Beware of Lurking Variables and Causation • Watch out when dealing with data from summaries
Goals of Re-expression • Goal 1 • Make the distribution of a variable more symmetric
Goals of Re-expression • Goal 2 • Make the spread of several groups more alike
Goals of Re-expression • Goal 3 • Make the form of a scatterplot more nearly linear. • Goal 4 • Make the scatter in a scatterplot spread out evenly rather than following a fan shape