Download
1 / 27
310 likes | 712 Views
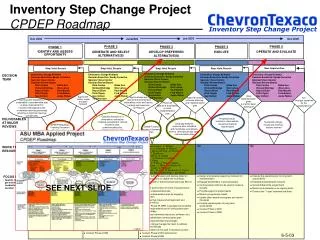
Inventory Step Change Project. Decision Support Package CPDEP Phase 2 June 5, 2003 Background for the June 12 Phase 2 DRB Meeting. The Opportunity. Our Vision. Phase 2 Approach & Findings. Recommen-dations. Business Case. Phase 3 Plan. Phase 2 Wrap Up & Next Steps.

E N D
Inventory Step Change Project Decision Support Package CPDEP Phase 2 June 5, 2003 Background for the June 12 Phase 2 DRB Meeting
The Opportunity Our Vision Phase 2 Approach & Findings Recommen-dations Business Case Phase 3 Plan Phase 2 Wrap Up & Next Steps THE OPPORTUNITY Develop and implement sustainable, corporate-wide process improvements in inventory management and investment recovery resulting in a step change increase in benefits and savings.
ü ü q q The Opportunity Our Vision Phase 2 Approach & Findings Recommen-dations Business Case Phase 3 Plan Phase 2 Wrap Up & Next Steps PHASE 2 APPROACH AND FINDINGS
DATA GATHERING & ANALYSIS Benchmarking Data Analysis Recommendation Generation (300+ ideas) Gap Analysis Best Practices Analysis 13 Recommendations Evaluation & Analysis Supplier Analysis Stakeholder Inquiry Phase 2 Approach and FindingsOverview Phase 2 has focused on data gathering and analysis to understand the gap between the current state and vision. The gap analysis has provided clarity on the steps that must be taken by ChevronTexaco to become an Industry Leader.
Phase 2 Approach and FindingsBenchmarking Background • Scope included only oil and gas remote international upstream warehouses • Participants included: ChevronTexaco, ExxonMobil, ConocoPhillips, Royal Dutch Shell, Hess, Hunt Oil and KIO Benchmark Findings • CVX average is currently top 3rd quartile based on inventory per BOE and other key benchmarks • To achieve bottom 1st quartile, CTOP would have to reduce inventory by $378MM (52%) • Industry and CVX is not achieving economies of scale based on production. There is a linear relationship between production and inventory • CVX downstream would need to reduce inventory levels by 60% to achieve mid-2nd quartile performance (based on the 2002 AT Kearney Downstream benchmarking study).
Background Collected and analyzed inventory data from the following locations: CTOP: TCO, CNL, Angola and Indonesia DSAR: Pascagoula, Richmond and El Segundo AMEA: Cape Town, Lytton Reviewed 10 to 15 inventory performance metrics utilizing 3 to 7 years of transactional data (dependent on SBU data availability) Grouped spend into projects, capital, expense, surplus (based on coding) and determined dead and excess inventory based on current usage rates Data only includes known inventory; shadow inventory is not included, but may be sizeable Data Analysis Findings There are significant variances in the way material is classified within CVX SBUs do not monitor the basic metrics covered by the study The analysis showed that CTOP inventory levels could be reduced by $330MM to $486MM and still provide high service levels (requires implementation of identified recommendations) For 19% of active inventory items, current inventory levels are greater than five-year average demand (% based on value) For 39% of active inventory items, current inventory levels are greater than one-year average demand (% based on value) Over a 3 year period, only 9% of the items had activity in each year 43% of the inventory was found to be slow moving; 40% of CTOP inventory is assumed to be dead; 60% of Downstream inventory is assumed to be dead Phase 2 Approach and FindingsData Analysis
Aera Energy BearingPoint Burlington Resources Campbell Soup Dupont Federal Express Fluor Daniel General Electric Halliburton/KBR Hunting Vinson Husky IBM Jacobs Engineering Kimberly-Clark McJunkin Supply MRO Software (Maximo) (1) OndeoNalco Peter Kiewit Construction Co. Proctor & Gamble Servigistics (1) Southern California Edison Sysco Food Corporation Tenaris The Southern Company Mirant TXU Weyerhaeuser Wilson Supply Phase 2 Approach and FindingsBest Practice/Supplier Discussions The team held best practice/supplier discussions with following companies: (1) These discussions included the review of several companies, including Dell After Market Services, Subaru Service Parts and the United States Airforce.
Finance/Comptrollers PRC Operational Assurance Sanha Gas Condensate Benguela Belize Phase 2 Approach and FindingsStakeholder Inquiry The team was able to conduct stakeholder sessions despite significant world events over the past 4 months. Meetings were conducted with the following groups: CTNAU • All business units CTOP • TCO • Indonesia • Angola • Nigeria (currently underway) Stakeholder Inquiry DSAR • Richmond • Pascagoula Procurement • Capital project procurement • Category managers • eProcurement Small Capital Projects • Angola • Nigeria
ü ü ü q q q The Opportunity Our Vision Phase 2 Approach & Findings Recommen-dations Business Case Phase 3 Plan Phase 2 Wrap Up & Next Steps RECOMMENDATIONS
RecommendationsTypes of Recommendations Given the significant gap between CVX’s current state and vision, a phased approach to implementation is recommended. Fundamentals must be addressed before CVX can tackle major advancements; therefore, recommendations have been categorized into 3 tiers: Foundational, Automation, and Optimization. Recommendations that leverage the integrated processes and systems to effectively utilize decision support, advanced planning tools, and supplier integration. Optimization Recommendations focused on the integration of people, process, and technology across functional boundaries to eliminate redundancy and improve productivity. Automation Core recommendations that must be in place to provide base service or to enable future optimization. Foundational
RecommendationsOverview See Appendix C for Recommendation Integration and Dependency Maps.
ü ü ü ü q q q q The Opportunity Our Vision Phase 2 Approach & Findings Recommen-dations Business Case Phase 3 Plan Phase 2 Wrap Up & Next Steps BUSINESS CASE
Business Case 3 Year Savings Estimates Three Year Savings Investment Recovery from Non-Inventory $ 179 MM $ 104 MM Inventory Management 111 - 185 MM 60 - 96 MM Capital Spares 22 MM 10 MM 312 - 386 MM 174 - 210 MM Gross CVX Share • Savings Components: • Cost of capital (10%) for inventory reduction • Proceeds from sales / redeployment • Administrative / labor reduction savings and increased utilization • Cost avoidance associated with shrinkage and obsolescence • Cost avoidance from capital spares
Business Case5 Year Savings Estimates Five Year Savings Investment Recovery from Non-Inventory $ 272 MM $ 144 MM Inventory Management 172 - 345 MM 81 - 162 MM Capital Spares 44 MM 20 MM 488 - 661 MM 245 - 326 MM CVX Share Gross
ü ü ü ü ü q q q q q The Opportunity Our Vision Phase 2 Approach & Findings Recommen-dations Business Case Phase 3 Plan Phase 2 Wrap Up & Next Steps PHASE 3 PLAN
Phase 3 PlanDesign and Implementation Approach Each recommendation was evaluated to determine the optimal approach for design and implementation. Three distinct scenarios were considered: DESIGN IMPLEMENTATION Œ Global Design and Global Implementation or Global Design and Local Implementation or Ž Local Design and Local Implementation
Phase 3 PlanProposed Teams The Inventory Step Change team proposes launching the following teams to move forward with design and implementation of recommendations: • Warehouse Ability to Serve • Stock Addition and Data Structure • Accountability and Performance Measures • Standard Investment Recovery Processes and Procedures • Integrated Planning, Forecasting and Replenishment • Third Party Support and Tools for Investment Recovery • Capital Spares Procurement • Supplier Integration Each team will be assigned one or more of the 13 proposed recommendations. Assignments are outlined on the following page.
Phase 3 PlanProposed Teams Third Party Support and Tools for Investment Recovery Integrated Planning, Forecasting and Replenishment Warehouse Ability to Serve Capital Spares Procurement Stock Addition and Data Structure Supplier Integration Accountability and Performance Measures Standard Investment Recovery Processes and Procedures
Phase 3 Plan Phase 3A Resource Requirements The Corporate Inventory Step Change Team will lead the teams. However, SBU involvement in extended teams is critical in phase 3A.
Phase 3 PlanProject Costs Estimated Project Costs • Project Cost Assumptions • Costs are for global support and systems only • Each SBU will need to plan, allocate, and/or fund resources to implement the recommendations • Although system costs are estimated, there are significant unknowns that will be clarified in phase 3A (in $ thousands) Total estimated costs for Phases 3 and 4 are $8.6 M
ü ü ü ü ü ü q q q q q q The Opportunity Our Vision Phase 2 Approach & Findings Recommen-dations Business Case Phase 3 Plan Phase 2 Wrap Up & Next Steps PHASE 2 WRAP UP & NEXT STEPS
Phase 2 Wrap Up & Next StepsDecision Quality DQ Spider Summary Results Meaningful Information (3.75) Creative, Doable Alternatives (4.35) Clear Values & Trade-offs (3.75) Appropriate Frame (5.0) Logical Reasoning (4.1) Commitment to Action (4.0)
Phase 2 Wrap Up & Next StepsDecision Quality DEQ Assessment Summary Results CPDEP Phase 2 - Select Alternatives Decision Quality Execution Rating Weight Total Rating Weight Total Multifunctional Teams Project Execution Planning X = 0.79 10 7.9 0.70 10 7.0 X = Stakeholder Involvement Roles & Responsibilities Defined X = 0.73 10 7.3 0.70 10 7.0 X = Decision Quality Front End Loading (Not Assessed) X = 0.70 20 14.0 NA NA NA X = Roadmapping VIP and Best Practice Usage X = 0.80 5 4.0 0.76 10 7.6 X = Pacesetter Objectives Next CPDEP Phase Planning X = 0.70 10 7.0 0.80 5 4.0 X = DQ Total Ex Total 40.1 25.6 DQ Total + EX Total = Decision & Execution Quality Index 65.7 / 90
Phase 2 Wrap Up & Next StepsWhat We Need From You • Reach agreement on recommendations and business case • Identify concerns or issues to be addressed • Provide guidance or input on the plan • Provide approval to proceed with Phase 3A