Download
1 / 44
440 likes | 531 Views
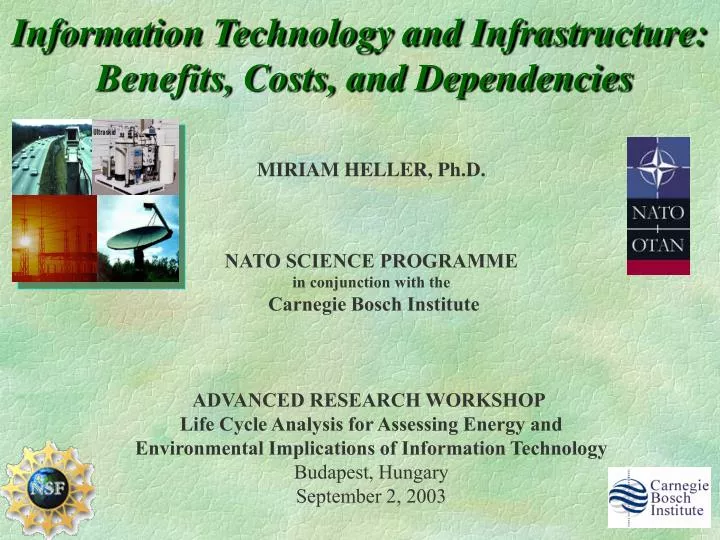
MIRIAM HELLER, Ph.D. NATO SCIENCE PROGRAMME in conjunction with the Carnegie Bosch Institute ADVANCED RESEARCH WORKSHOP Life Cycle Analysis for Assessing Energy and Environmental Implications of Information Technology Budapest, Hungary September 2, 2003.

E N D
MIRIAM HELLER, Ph.D. NATO SCIENCE PROGRAMME in conjunction with the Carnegie Bosch Institute ADVANCED RESEARCH WORKSHOP Life Cycle Analysis for Assessing Energy and Environmental Implications of Information Technology Budapest, Hungary September 2, 2003 Information Technology and Infrastructure: Benefits, Costs, and Dependencies
Messages • ICT Confers Benefits To Infrastructure Systems; (Avoided) Costs May Be Easier to Quantify • Infrastructure Systems Differ from Other Manufacturing and Service Systems • Infrastructure Dependencies May Give Way to Indirect Environmental and Energy Consequences, Which Could Figure Into Life Cycle Cost/Benefit Analysis of ICT and Infrastructure System Planning and Management
TOPICS • Infrastructure Systems • Infrastructure Interdependencies • Benefits and Costs of IT and Infrastructure Systems • Related IT and Infrastructure Research • Cyber* Futures at NSF • Challenges for Research
A Definition of Infrastructure Systems • Networks of facilities and institutions • Support the flow of people, energy, other resources, goods, information, and basic services • Essential to life, economic well-being, and national security.
Critical Infrastructures (PDD 63) Potable & Waste Water Transportation Banking & Insurance Telecom-munications Government Electricity Emergency Response Oil & Gas
Integrated Information Systems Oil & Gas Power Information Technology & Telecom Transportation Water Treatment
ICT Benefits for Infrastructure Systems Enterprise Integration/ Optimization Community Eco-efficiency/ Sustainability Process Control / Supervision Product Integration/ Interoperability Shared Resources / Environment Shared Objectives Industrial Ecology Shared Data Enterprise Architecture Communications Architecture Automated Monitoring, Sensing, Data Acquisition Performance and Efficiency Baseline from Core Utility Processes Time (Adapted from Heller et al.,1999)
Infrastructure Systems: Some Reflections • Differ from Manufacturing Systems • Provide critical services / lifelines • Geographically distributed • One-offs with many degrees of freedom • Highly interconnected • Subject to uncertain and uncontrollable ambient conditions • Life-Cycle Modeling Differences • Uncertainty • High consequence / low probability events vs. slow consequence / high probability events • Life-span definition (whole-life) • Complexity
Infrastructure Interdependencies Financing & policies SEC; IRS E L E C T R I C I T Y I T & T E L E C O M Banking & Finance Trading, transfers e-commerce, IT Regulations & enforcement FERC; DOE Currency (US Treasury; Federal Reserve ) Government e-government, IT Communications Financing & policies Personnel/Equipment (Military) Detection, 1st responders, repair Medical equipment Emergency Response FEMA; DOT Location, EM contact Fuel transport, shipping Fire suppression Transport of emergency personnel, injured, evacuation Signalization, switches, control systems Transportation DOT SCADA Fuel transport, shipping Fuels, lubricants Fuels, Heat Generator fuels, lubricants Financing, regulations, & enforcement Storage, pumps, control systems, compressors Oil & Natural Gas DOE;DOT Communications SCADA Chemicals transport Water for production, cooling, emissions control Water for cooling, emissions control Potable & Waste Water EPA Heat SCADA Pumps, lifts, control systems Cooling Switches, control systems
Science of Engineered Networks In 1736, Leonhard Euler the Swiss Mathematician idealized this as a system of nodes and arcs. Euler proved that it cannot be done unless every node is connected to every other with even degree. Köningsberg on the Pregel River with 7 bridges. Cross each bridge exactly once and return to starting position.
Science of Engineered Networks:Dependencies • Random networks, generated by randomly connecting a new node with an existing node, have on average, the same number of connections per node, e.g., National Highway System (Barabási, 2002). Distribution of nodes connections is normal. • Scale-free networks (WWW, air traffic routes, social networks) arise when new nodes connect preferentially to already well-connected nodes. Most nodes have few connections: a few nodes are heavily connected hubs. Distribution of nodes connections follows a power law.
Power Grid Outages Follow Power Law 1 10 0 10 US Power outages 1984-1997 -1 10 August 10, 1996 -2 10 4 5 6 7 10 10 10 10 N= # of customers affected by outage Frequency (per year) of outages > N Data from NERC (Amin, 9/10/01)
ICT Impacts Infrastructure SystemsExample: 2001 California Power Crisis • Disrupted fuel production, refining, and distribution, sometimes cut off fuel supplies to the very plants that should have been generating their electricity • Interrupted water distribution affected the state's agribusiness • Soaring wholesale power prices impacts rippled through the region, leading to relaxation of salmon-protection and air-quality regulations and shutdown of aluminum mills in Washington state. Idaho farmers curtailed potato production to exploit Idaho Power Company's electricity buy-back program
Coupled Systems Frameworks : Rinaldi et al., 2001 Escalating Cascading Common Cause Spatial Temporal Operational Organizational Loose/Tight Linear/Complex Normal Adaptive Inflexible • Physical • Cyber • Logical • Geographic Business Public Policy Security Health/ Safety Stressed/ Disrupted Repair/ Restoration Economic Legal/ Regulatory Technical Social/ Political Type of Failure Infrastructure Characteristics Coupling/ Response Behavior State of Operation Natural Environment ? Types of Interdependencies Environment
State of the Water/Wastewater System • Size • 15,000 Publicly-Owned Wastewater Treatment Plants • 100,000 Pumping Stations • 160,000 Public Potable Water Systems • Operations • Accounts for 3-7% Total US Electricity Consumption • ASCE Estimates $12 Billion Needed for Maintenance 2012
ICT Benefits for Water/Wastewater Systems Utility Integration/ Optimization Process Control / Supervision Plant Integration/ Interoperability Shared Objectives Shared Data Utility Business Architecture Utility Communications Architecture Automated Monitoring, Sensing, Data Acquisition Process Level IT (SCADA, GIS, EMS, CIS, MMS, LIMS, hydraulic, water quality, and distribution network models Reduced Chemical and Energy Consumption, Lower Operating Costs, Improved Regulatory Compliance, Higher Reliability, and Improved Customer Service, Inventory Control, and Maintenance Management Performance and Efficiency Baseline from Core Utility Processes Time (Adapted from Heller et al.,1999)
Harnassing Complexity through Shared ResourcesEnergy and Water Quality Management Systems (Jentgen, 2001) Operations Planner & Scheduler System Scheduler: Surface Water Treatment Plant Pump Stations Distribution Customer Collection Wastewater Treatment Water Consumption Forecast Power Supply Contract Terms/Conditions Energy Cost Scheduler (Electric Utility) Interruption Scheduler Signal Power Suppliers’ Price Schedule Energy Cost Schedule Hydro Schedule Performance Criteria Consumption Forecast Program Operating Plan Schedule & Control Management Scheduler Raw Water Supply/ Water Treatment Plant System Operating Plan Operations Clearance Approvals Pump Stations Automated Maintenance Management System Operating Plan Distribution Water Quality Operating Constraints Water Resource Schedule/Constraints Customer Regulations Clearance Work Orders Collection Water Source Analyzer Water Quality Analyzer Water Law Water Rights Water Priorities Water Quality Alarms Wastewater Treatment Plant Water Quality Data SCADA Data Lab & Field Samples Utility’s Historical Operating Data Performance Criteria
Potential ICT Benefits for Water/Wastewater Regional Eco-efficiency/ Sustainability Industrial Ecology Utility Business Architecture Utility Communications Architecture Automated Monitoring, Sensing, Data Acquisition Process Plant Utility/Facility Control / Integration/ Integration/ Supervision Interoperability Optimization Shared Resources / Environment Performance and Efficiency Shared Objectives Shared Data Baseline from Core Utility Processes Time (Adapted from Heller et al.,1999)
Industrial Symbiosis Example:Baytown’s Water Infrastructure (Nobel & Allen, 1998) • 21 process, 5 utility streams • 75 feasible reuse pathways identified
Linear Program Formulation GC I1 WWTP WTP I2 I3 Fresh Reclaimed Reused Disposed Exchange Feasibility • Based on water quality parameters (e.g., TOC, TSS, TDS) • Creates input for cost optimization • feasible exchange pathways, i.e., “arcs” • “type” of water • transportation costs
Industrial Symbiosis: Optimal Water Use (Nobel & Allen, 1998) Fresh Water Cost Metrics Usage D D Scenario % % mgd $/day Base Case 8.71 - 108,554 - Minimum Cost 1.05 -88% 57,165 -47% Minimum Fresh Water 0.26 -97% 85,098 -22%
ICT Benefits for Oil and Gas Infrastructure Example: BP’s Texas City Plant • “Project Future” (Bylinsky, Fortune, “Elite Factories,” 9/1/2003) • Combined Refinery / Petrochemical Plant • $30 bbl Oil $60 of Gasoline, Diesel, Jet Fuel, p-Xylene • 2,740 Employees • 2-year, $75 Million Investment in Computerization and Automation of 650 Key Valves • Returns On Investment • Start-up Time Reduced from 2 Weeks to 3.5 Days • Real-Time Equipment Setpoints Based on Ambient Temperature, Weather, and Product Prices • 3% Less Electricity Used • 10% Less Natural Gas Used • 55% Increase in Productivity } $ Millions and Tons GHG Saved
State of Oil and Gas Infrastructure Systems • Size • Ports, Refineries, Transportation • 2,000 Petroleum Terminals • Almost 1 Million Wells • 2,000,000 Miles of Oil Pipelines • 1,300,000 Miles of Gas Pipelines and Increasing • Operations • Pipeline and Distribution System • Leak Detection • Monitoring and Control Systems • More Efficient Use of Existing Pipe • Aging • Coupled Economic Models on Natural Gas and Electric Power
State of the Transportation System • Size • 125,000 Miles of National Highway System • 25,000 Miles of Public Roads • 3.76 Million Miles of Other Roads • Operations • FHWA : > $78 Billion / Year Idled Away in Congestion • 50% Total US Petroleum Consumed by Highway Vehicles • > 1/3 GHG Due to Surface Transportation • Major Source of Photochemical Smog and Other Air Pollution • > 40,000 Fatalities / Year Over Past Decade
Potential ICT Benefits for Transportation • Inform on-line buyers of environmental impacts of shipping options(NAE, 1994; Hawken et al., 1999; Sui & Rejeski, 2002) • Ship or rail: 400-500 BTU/ton-mile • Truck : >2000 BTU/ton-mile • Air freight : > 14,000 BTU/ton-mile • Reduce Travel: Telework, Telecommute, Teleconference, Virtual Tradeshows • Improve Urban Planning and Policy regarding • Land use • Environmental quality • Social equity • Infrastructure operations and maintenance • Increase On-Board Traveler Productivity
Potential ICT Benefits for Transportation • Advanced Traveler Information Systems (Real-time) Influence on Traveler Behavior and Improved Traffic Models • Intelligent Computer Vision Enhanced Traffic Modeling Improved Traffic Models & Collision Avoidance • Real-time Emissions Monitoring Coupled Traffic and Air Quality Models • Wireless Communications Networks Improved Data Acquisition, Data Management, and Traffic Control • Congestion Pricing Control Demand • En-route Commerce Optimize Supply • Optimal and/or Dynamic Routing • Intermodal Models Improved Transportation Models
State of the Electric Power Grid • Size • ~200,000 Miles of Transmission Lines • 5000 Power Plants, 800,000 Megawatts • Transmission level(meshed network of extra high voltage, > 300 kV, & high voltage, 100-300 kV, connected to large generation units and very large customers; tie-lines to transmission networks, and to sub-transmission level) • Sub-transmission level(radial or weakly coupled network with some high voltage, 100-300 kV, but typically only 5-15 kV, connected to large customers and medium sized generators) • Distribution level(tree network of low voltage, 110-115 or 220-240 volts, and medium voltage, 1-100 kV, connected to small generators, medium- sized customers, and to local low-voltage networks for small customers)
State of the Electric Power Grid • Urbanization load growth • 2.1+ % annual national growth over last 25-years result in a 50% increase by 2014 - 2020 • Nearly no new HV transmission lines in last 25 years • 1988-98, 30% growth in total U.S. electricity demand is met with transmission network growth of 15% • Re-regulation with privatization • Uncertainty ROIs • NIMBY • Right-of-way restrictions for T&D expansion • Tightening fuel supplies to meet increased demand
State of the Electric Power Grid • Operations • 8/15/03 blackout affected > 20 millions of people, water supply, wastewater conveyance, transportation, communications, hospitals, banking, and retail sales • ICT safety equipment tripped to protect power plants and contain the outage causing cascading failures • 9 nuclear power plants automatically powered down safely • EPRI : $1.5 billion for July-Aug 1996 power blackouts • CEIDS : $119 billion / year in power quality disruptions
Potential ICT Benefits for Electric Power • EPRI/DoD Complex Interactive Networks Initiative • Goal: Develop tools that enable secure, robust and reliable operation of interdependent infrastructures with distributed intelligence and self-healing abilities • Systems’ approach to complex networks: advancing mathematical and system-theoretic foundations • Target theoretical and applied results for increased dynamic network reliability and efficiency • Identify, characterize, and quantify failure mechanisms • Understand interdependencies, coupling and cascading • Develop predictive models • Develop prescriptive procedures and control strategies for mitigation or/and elimination of failures • Design self-healing and adaptive architectures • Trade-off between robustness and efficiency
“The best minds in electricity R&D have a plan: Every node in the power network of the future will be awake, responsive, adaptive, price-smart, eco-sensitive, real-time, flexible, humming - and interconnected with everything else.”—Wired Magazine, July 2001http://www.wired.com/wired/archive/9.07/juice.html The Energy Web: “…a network of technologies and services that provide illumination…” From M. Amin, 2001
Enabling ICT for Electric Infrastructure • Materials: Superconductors and wide bandgap semiconductors • Monitoring: WAMS, OASIS, SCADA, EMS • Analysis: DSA/VSA, PSA, ATC, CIM, TRACE, OTS, ROPES, TRELSS, market/risk assessment • Control: FACTS; Fault Current Limiters (FCL) • Distributed resources: Fuel cells, photovoltaics, Superconducting Magnetic Energy Storage (SMES) • Next generation: integrated sensor; 2-way communication; "intelligent agent" functions: assessment, decision, learning; actuation, enabled by advances in semiconductor manufacturing From M. Amin, 2001
Intelligent Adaptive Islanding 230 kV 345 kV 500 kV 35 33 32 30 31 74 80 79 66 75 78 72 76 v v 77 82 81 84 85 86 83 162 112 161 156 157 114 11 5 167 155 165 44 159 158 6 45 160 115 166 163 18 17 118 13 8 12 7 108 119 138 139 109 9 107 14 37 110 104 63 64 103 147 3 143 4 154 146 102 142 56 48 153 151 145 136 49 47 140 152 19 150 141 149 57 42 43 50 16 15 From M. Amin, 2001
System Risk is a Function of System State P(Ht,s) = probability of a hazard at time t (and system state s) P(Ds|Ht,s) = probability of a particular level of vulnerability of a system in state s given a hazard at time t (and system state s) E(L|Ds) = expected losses conditioned on the vulnerability of system in state s E(L) = S S E(L|ds) * P(ds|ht,s) * P(ht,s) ht,s ds
Life-Cycle Infrastructure Asset Management Communication/ Education Social/ Cultural Values Financial/ Insurance Instruments Organizational Theory Policy/ Law Detection, Preventive Maintenance, Lifetime Extension, Early Warning Emergency Response, Diagnosis Planning, Training and Preparedness Recovery, Corrective Maintenance, Deconstruction,Reuse Modeling, Simulation, Multi-Objective Multi-stakeholder Decision-Making Prediction Predictive Maintenance, Sensing, Monitoring, Data (Storage, Transmission, Retrieval) • Life-Cycle Analysis • Internal, Direct Impacts • External, Indirect Impacts • Systems Evaluation Life-Cycle Design
Multi-Objective Multi-stakeholder Decision-Making 1 2 3 1 ~ 2 ~ 3 : indifferent wrt ER 1 is infeasible wrt obj. S&M 2 >> 3 : 2 dominates 3 B/C ( S&M) B/C (ER) • Allocation problem over various investment options, over various stages of development (R&D, development, implementation) over time with risk/uncertainty • Multiple objectives : efficiency, reliability, security, resiliency, sustainability • Multiple stakeholders : different institutional boundaries, missions, resources, timetables, and agendas
Challenges for Research in Life-Cycle Analysis of IT and Infrastructure • Critical Infrastructure Inventory Data • Scalable Environmental Knowledge Architecture • Models of Individual Infrastructure Systems • Models of Coupled Infrastructure Systems • System Response and Resiliency • System state /vulnerability analysis • Consequence models (boundaries, data, methods) • Extreme value statistics • Substitute services / alternate pathways • Measures of Network Performance • Life-Cycle Infrastructure Asset Management Modeling
“CyberInfrastructure” Vision • “Atkins report” • Blue-ribbon panel, chaired by Daniel E. Atkins • Calls for a national-level,integrated system of hardware, software, & data resources and services • New infrastructure to enable new paradigms of scientific/ engineering research and education http://www.cise.nsf.gov/evnt/reports/toc.htm
What CyberInfrastructure Means • Infrastructure that enables distributed, reliable, real-time collaboration and analysis requiring large-scale, dynamic information storage and access • Examples of components to be integrated: • Major computational processing capabilities • Unique experimental facilities • High-speed networks • Tele-participation and tele-operation tools • Networks of data collection devices • Data/metadata storage and curation • Data analysis and information extraction tools • Universal access
What Makes CyberInfrastructure Unique • Cyberinfrastructure : more than the sum of its component parts – the key is integration
Examples of Early CyberInfrastructure • George E. Brown, Jr. Network for Earthquake Engineering Simulation (NEES) • Extends national capacity for earthquake engineering through unique, shared infrastructure • What makes NEES CyberInfrastructure? • Real-time video & data enable participation from remote sites • Real-time communications allow experiments to span facilities, link physical experiments with numerical simulation • 15 experimental facilities linked by common network, data repository, tools, metadata
Examples: NEES’s Distributed Users and Distributed Resources Unique Laboratory Facilities Equipment Site 1 Earth.Eng. Researchers Data Repositories & Computational Resources Equipment Site 2 Practitioners Equipment Site 3 NEES Consortium Emergency Communities . . . Equipment Site 15 K-14 Education User Communities Other Site A NEESgrid Other Site B
Other NSF ICT-Relevant Programs • CLEANER Small Planning Grants • Nick Clesceri, BES, • Sensors and Senor Networks • Shih-Chi Liu, CMS, sliu@nsf.gov • Information Technology Research • Cybertrust and Cybersecurity
Thank You For Your Attention ! ? MIRIAM HELLER, Ph.D. Infrastructure & Information Systems Program Director National Science Foundation Tel: +1.703.292.7025 Email: mheller@nsf.gov