Download
1 / 25
250 likes | 410 Views
How New Zealand estimates forest carbon . Peter Beets, Thomas Paul, Chris Goulding, Mark Kimberley, Loretta Garett and many others. The National reporting level. Wall-to-wall mapping Indigenous, pre-1990 and post 1989 planted forests Forest inventory incl. LiDAR

E N D
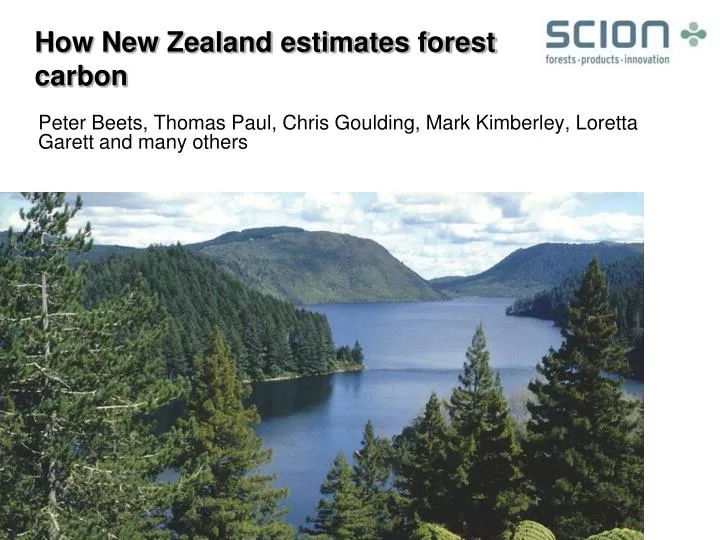
How New Zealand estimates forest carbon Peter Beets, Thomas Paul, Chris Goulding, Mark Kimberley, Loretta Garettand many others
The National reporting level • Wall-to-wall mapping • Indigenous, pre-1990 and post 1989 planted forests • Forest inventory incl. LiDAR • Modelling carbon stocks and sequestration
LUCAS – Land Use and Carbon Analysis System (Ministry for the Environment) • To monitor carbon stocks and changes LULUCF • Natural forests • Planted pre-1990 forest “pre-Kyoto” forests • Planted post-1989 afforestation “Kyoto” forests • Reporting under Article 3.3 of the Kyoto Protocol • Carbon stocks & changes annually in 5 pools in post-1989 forest • Activity data – mapping of afforestation, reforestation and deforestation since 1990 • Transparency requirement - LUCAS calculation and reporting application (CRA) database
Wall to wall mapping • Provides area of • Indigenous forest • Pre-1990 planted forests • Post-1989 forest • Other landuses • Carried out in 1990, 2000, 2008, 2012
Systematic 8x8 km grid 0.06 ground plots; trees & history data LiDAR double sampling Systematic 4x4 km grid 0.06 ground plots; trees & history data LiDAR double sampling
Field measurements (live and dead pools require): • Ground plot • Location, horizontal area, site fertility. • Trees • DBH (of each tree). • Height (of a representative sample). • Past tending regime • Initial stocking. • Age and stocking at each thinning operation. • Age and prune height at each pruning operation. • Silvicultural intentions • Intended thinning/pruning regime.
Regime ( p a s t a n d f u t u r e s t o c k i n g / p r u n i n g ) Outerwood Density Top Height Age Stocking Basal Area 300 Index Density Model G r o w t h M o d e l Yield Table ( a n n u a l s t o c k i n g , s t e m v o l u m e & s t e m d e n s i t y ) C-Change Annual Carbon Pools Modelling of Carbon pools: Forest Carbon Predictor Inputs: Processing: Outputs:
Different forests – adjusted inventories • Post-1989: • Pre-1990: The NZ Government is obligated to report on carbon stocks and changes in post-1989 afforested land for the period 2008-2012 and stock changes from deforestation of all forest land for the period 2008-2012
Light Detection and Ranging (LiDAR) You get for example: • Crown density • Various Heights • DTM
Use of LiDAR – Double sampling design • Utilize ground plot network • Develop regression equations that estimate carbon stocks as a function of LiDAR data. • Use regressions to estimate average carbon per hectare.
Improvement using a LiDAR double sampling approach (example pre-1990 planted forest inventory) • 191 ground plots and 767 additional LiDAR plots • LiDAR explained 80% of variation in C stocks. • Nationally, the 95% PLE decreased from 14.1% to 11.1% using LiDAR. • 122 additional ground plots would have been necessary to achieve comparable precision.
The forest owner level (Emission Trading Scheme) • Wall-to-wall mapping • Yield tables and plots • Modelling carbon stocks and sequestration
Important • Carbon credits ETS <= National level • Deforestation and harvesting area • Synchronised approach
Carbon stock change (sequestration) • National LUCAS approach - difference between stock estimates from two ground measurements, LiDAR adjusted (2012 – 2008 stocks). • ETS field measurement approach – difference between stock estimate from one ground measurement and modelled projection (backcast/forecast to 2008/2012). • ETS future approaches – double sampling using LiDAR, or improved carbon lookup tables.
LiDAR data • LiDAR point clouds coloured by height - low (left) and high (right) Leaf area plots. • Overhead view of points within 3m of the ground surface in low (b) and high (c) Leaf area plots. • LiDAR explains 80% of LAI
Forest inventory • LiDAR explains around 80% of the variation in volume and carbon stocks. • Divide the LiDAR sample transects into “aerial” plots of similar size to the ground plots. • Double sampling using LIDAR is one third the cost of entirely ground-based inventory.
Model R2 - volume increment and carbon sequestration - LiDAR explains more than half the variation – but supplementary site and crop data is useful
Future - Silvicultural effects from LiDAR • Stocking • LiDAR canopy image with heights mapped to grey values (ground is black, tops are white) • Suitable for 2D tree counting software.
Research questions • Is LiDAR too expensive for small forest areas- coordination as done for Dothistroma? • If LiDAR is used what about the 20% variation that is unexplained? • Campaign effects – leaf area • Silvicultural – tree stocking. • Genetics – material type. • What are impacts of foliar diseases on metrics and relationships? • Log value, biodiversity (native forest carbon) are future focus areas
Conclusions • LiDAR reduces the requirement for ground plots, but can not entirely replace ground plots. • Forest specific LiDAR regression models – it may be possible to tailor national model using site and stand data. • Changes in crown health over space and time – effect on: • carbon stock regressions. • carbon stock change regressions. Many opportunities
Acknowledgements LUCAS planted forest inventory data and associated research funding were provided by the Ministry for the Environment. LiDAR capability funding was provided by Scion