Download
1 / 46
460 likes | 589 Views
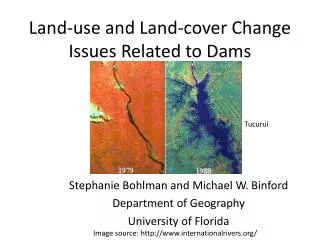
Evaluation of New Jersey Land Use Change in Relation to Spatial Proximity to Wetlands. David Tulloch, Rick Lathrop, and Eric Yadlovski Center for Remote Sensing and Spatial Analysis Cook College Rutgers, The State University or New Jersey. BACKGROUND.

E N D
Evaluation of New Jersey Land Use Change in Relation to Spatial Proximity to Wetlands David Tulloch, Rick Lathrop, and Eric Yadlovski Center for Remote Sensing and Spatial Analysis Cook College Rutgers, The State University or New Jersey
As New Jersey continues to develop, its landscapes are undergoing notable changes. • This statewide pattern has many local ramifications.
LULC + Time = Change • The New Jersey DEP has repeatedly engaged in processes of measuring and mapping land use/land cover across the entire state of New Jersey • No other state has been as detailed in longitudinal LULC • Comparing these longitudinal data makes it possible to assess land use/cover changes over time
Wetlands • Within the changing landscapes of New Jersey, many are concerned about the impact that increased development may be having on wetlands • Not only are there concerns about developing ON wetlands, but there is a recognition that developing NEAR them can have significant impacts
New Jersey: A Changing Landscape • Previous research at CRSSA found that between 1986 and 1995: • 220,390 acres of land were developed • 6,710 acres of coastal wetlands were lost • 51,860 acres of inland wetlands were lost
New Jersey: A Changing Landscape • As the wetlands disappear, some of the change can be attributed to direct impacts by development on the wetlands. • Example: a permitted filling of 0.5 acres of wetlands for the construction of a home and driveway. • Other impacts could be attributed to indirect impacts • Example: the permitted filling leads to siltation and disturbance of adjacent wetlands causing loss of another acre of wetlands.
New Jersey: A Changing Landscape • Little is known about the spatial relationship between new development and wetlands loss. This is particularly true of indirect loss. • This project sought to identify and measure the potential areas of direct and indirect impact over two distinct time periods: 1986-1995 and 1995-2000.
New Jersey: A Changing Landscape • While it is clear that new development can impact adjacent wetlands, it is unclear how far that impact can carry. Some consider anything within 50 feet to be severely compromised and anything within 300 feet to be at risk. • Based on these assumptions, this project is using 50’ and 300’ as standards for identifying areas of potential impact.
Methodology • The start point for this research is the NJ DEP’s 1986 Land Use/Land Cover Classification. • This dataset identifies both wetlands and urban land uses.
Methodology • The 1986 LULC was compared with the 1995 LULC urban areas to identify land that was developed during that 9 year period. • This process was repeated comparing 1995 and 2000.
Methodology • The 1995 and 2000 areas of new development were then buffered by 50 feet and 300 feet – the resulting polygons show all areas within 300 feet of new development.
Methodology • All of these polygons (developed, 50’ buffers, 300’ buffers) were then clipped by the 1986 wetlands. • The result is a dataset and map which identifies: • all of the areas where new development occurred on wetlands (in 1995 and 2000), • all of the 1986 wetlands within 50’ of new development (in 1995 and 2000), and • all of the 1986 wetlands within 300’ of new development (in 1995 and 2000).
Local Outcomes and Findings • Maps of areas with significant impact or potential impact help viewers better understand patterns and implications of impacts • Clusters of impact and potential impact generally highlight areas with both: • Significant wetlands • Significant recent development
NJ TPK US 1
Caveats and Concerns • It is all imperfect data • Some is more imperfect than others • The 2000 data was used before it was finalized. This includes minor errors and subtle changes in the definitions of developed areas. • The 1995 data includes apparent changes due to corrections in attributes.
Caveats and Concerns • Positional Accuracy is different between datasets • 1986/1995 can be characterized as +/- 33’ • 2000 can be characterized as +/- 12m • Estimating areal error or inaccuracies particularly difficult without groundtruthing
Statewide Findings • For every acre of wetlands that are destroyed directly by conversion to an urban landuse, another 5 acres are exposed to potential degradation or loss due to their proximity to new development.
Statewide Findings • From 1986-2000 • A total of about 20,000 acres of wetlands were converted to urban uses • Roughly 15,000 acres of wetlands were within 50' of new development • Nearly 87,000 acres of wetlands were within 300' of new development • Monmouth, Burlington and Middlesex Counties were the most significantly impacted counties
Statewide Findings • During the 1986-1995 time period the Lower Raritan Basin (WMA 09) contained the most (12% of the state total) impact and potential impact that occurred in New Jersey • During the 1995-2000 time period the Upper Delaware Watershed (WMA 01) contained the most (12% of the state total)
Statewide Findings • Roughly half of the total impact and potential impact occurred on deciduous wooded wetlands. • Between 1986 and 1995 • Less than 200 acres of saline marsh were developed • But, about 2,000 acres were within 300 feet • That is a ratio of 19 to 1 compared with an average of 5 to 1 for all wetlands.
Statewide Findings • Coastal wetlands can be contrasted with areas that are already modified wetlands (like “agricultural wetlands (modified)” or “managed wetlands (modified)”) which were often developed without significant areas of other surrounding wetlands potentially impacted.
What next? • These data don’t show where impacts have occurred, they show where they could have occurred. • Field research should sample points from all three classes of areas to measure the nature and extent of impact. • Further stratification could better identify certain wetland types or development types most closely identified with the impact. • Longitudinal study of identified areas could measure the time required for indirect impacts to occur.
What next? • After field verification or calibration, these data could answer several policy questions • What is the appropriate distance for a wetlands buffer? • Do different land use policies or regulations favor specific types of wetlands? • Are there geographic or physiographic areas in which indirect impacts are more likely?