Download
1 / 14
140 likes | 279 Views
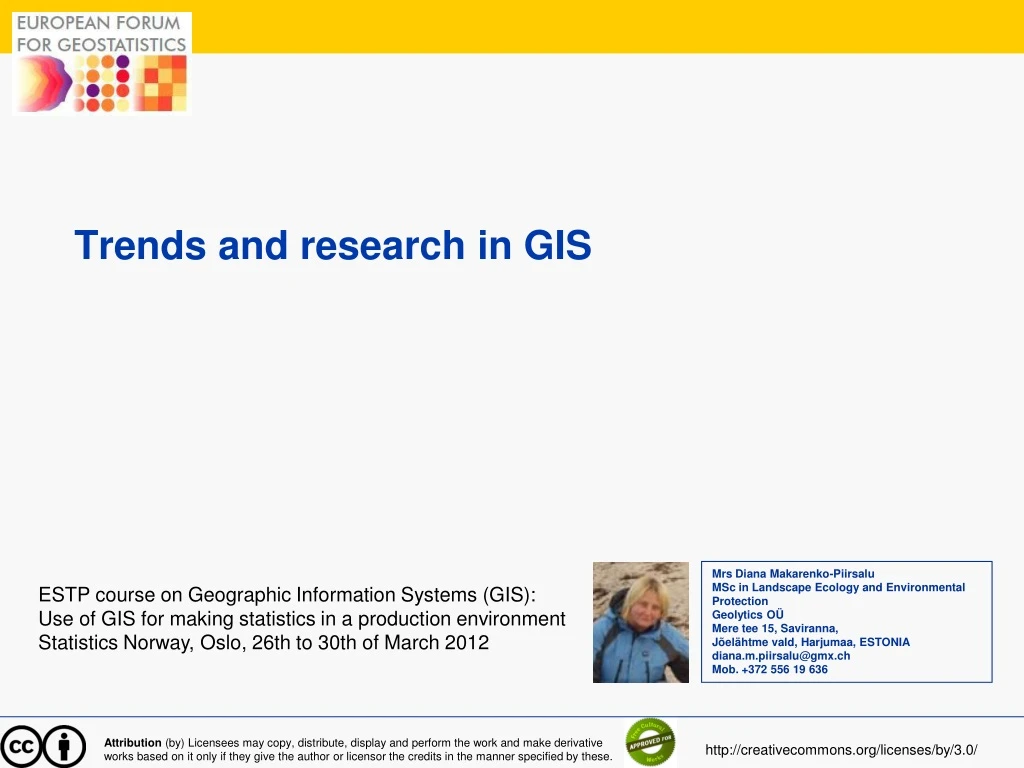
Trends and research in GIS. Mrs Diana Makarenko-Piirsalu MSc in Landscape Ecology and Environmental Protection Geolytics OÜ Mere tee 15, Saviranna, Jõelähtme vald, Harjumaa, ESTONIA diana.m.piirsalu @g mx.ch Mob. +372 556 19 636. ESTP course on Geographic Information Systems (GIS):

E N D
Trends and research in GIS Mrs Diana Makarenko-Piirsalu MSc in Landscape Ecology and Environmental Protection Geolytics OÜ Mere tee 15, Saviranna, Jõelähtme vald, Harjumaa, ESTONIA diana.m.piirsalu@gmx.ch Mob. +372 556 19 636 ESTP course on Geographic Information Systems (GIS): Use of GIS for making statistics in a production environment Statistics Norway, Oslo, 26th to 30th of March 2012 Attribution (by) Licensees may copy, distribute, display and perform the work and make derivative works based on it only if they give the author or licensor the credits in the manner specified by these. http://creativecommons.org/licenses/by/3.0/
Topics: • Brief overview of : • Change of the focus in research fields since 1970 • Developments in GIS users • Main challenge in GIS innovation • What is in researchers agenda today? • Trends in technology • Main challenges in producing gridded statistics
Trends • We try to measure and analyse everything • Data availability, sharing, reusing, interoperability is a priority • Geodata is not the exemption in this • Role of the 3rd sector is increasing • Open source software developments • GIS is everywhere and for everybody - innovation is more user driven
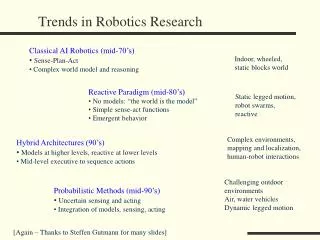
Cyclic innovation • 1970s – Focus on Mapping and Display - the research and early applications centered on Computer Mapping • 1980s - Focus was on Data Structures and Data management. Linking digital maps to attribute databases for geo-query • Next stage - Focus was put on the Analyses on Spatial Data , GIS Modeling for assessing spatial patterns and relations • 2000 – Mapping focus - Multimedia Mapping (mapping focus) • Advances in virtual reality • 3D visualization • Currently the focus is on data/structure, integration of data, interoperability, geocoding and geo tagging • In Geospatial analyses the focus is shifting from “static coincidence modeling” to “dynamic flows modeling” that tracks movement over space and time in three-dimensional geographic space Source: Joseph K. Berry, 2010 http://www.innovativegis.com/basis/Books/MapAnalysis/Default.htm
Developments in user community Decrease of knowledge of GIS users • 1970s – Firststeps in technology development, research focused on data structures, display capabilities, and a few basics operations • 1980s - vector processing of discrete spatial objects (point, line, polygon), databases, cartographic modeling took after the traditional manual map analysis, such as intersection, overlay, buffer and geo-quering • 90s – maturing GIS, moreuserfrendly GUI • 2000 - GoogleEarth, Bing Maps and otherdigitalglobedevelopments • General trend : A growing number of general users will become more comfortable with the technology and demand increased capabilities, particularly in spatial analysis, statistics and modeling Source: Joseph K. Berry, 2010 http://www.innovativegis.com/basis/Books/MapAnalysis/Default.htm
Open Source puts pressure to governmental dataproviders and commercial technology developers • Voluntary spatial data creation from users community (OSM) • Has put a pressure to official geodata providers to make their data more easily and more widely available • NMA starting to provide free access to their topographic datasets • NSI starting to provide free access to their gridded datasets • Open Source software development has put pressure on private companies: „Share with others“ - new business model Source of screen shots: www.esri.com
Trends in technology: – Cloud computing • virtualized resources • workloads are allocated among a multitude of interconnected computers acting as a single device • dynamically scalable • the system can be easily enlarged; • it isa service • software and data components are shared • The result is a “hosted elsewhere” : • for data and services • movement of applications, services, and data from local storage to a dispersed set of servers and datacenters • an advantageous environment for many data heavy and computationally demanding applications, such as geotechnology. Source: Joseph K. Berry, 2010, http://www.innovativegis.com/basis/Books/MapAnalysis/Default.htm
Trends in technology: – Cloud computing = „hosted elswere“ Source: Joseph K. Berry, 2010, http://www.innovativegis.com/basis/Books/MapAnalysis/Default.htm
What is on the GIS researchers agenda? • University Consortium for Geographic Information Science (UCGIS – www.ucgis.org)Proposesthemainemphasisesof GIS fieldsofreasearch: • SpatialDataAcquisition and integration- real time • Cognition of Geographic Information • Scale • ExtensionstoGeographicRepresentations • Spatial Analysis and Modeling • Research Issues on Uncertainty in Geographic Data and GIS-Based Analysis • The Future of the Spatial Information Infrastructure • Distributed and MobileComputing • GIS and Society: Interrelation, Integration and Transformation • GeographicVisualization • Geospatial Data Mining and Knowledge Discovery
Main challange - Spatial Data Acquisition and Integration • Geodata has become widely available • Enormous availability of data on www which can be linked with location • Wide variety of technologies GPS , mobile phones, IP addresses (moving objects), and applications (social networks) what contain directly or indirectly „geo“ info • Challenges: • How to integrate non- traditional data sources with traditional spatial data automatically, more efficiently and more accurately ? • How to visualize the data more reasonably?
An example from Norway • Norwegian national migration pattern, created by Even Westvang • Data aquisation from tax register linked with location (zip code) and interesting visualisation. • each particle represents a person moving from one ZIP code to another. • The more people moving from point A to point B, the faster the particles move Source: (http://flowingdata.com/2012/02/08/animation-shows-national-migration-patterns/?utm_source=twitterfeed&utm_medium=twitter)
LBS • Mobile Devices • Positioning • Communication Network Examples: (Source: www.positium.ee) http://www.positium.ee/voog/tallinn_commuting/ http://www.positium.ee/map3d/ Brimicombe, A.J. 2002 GIS – Where are the fronties now? In: Proceedings GIS 2002.
Main challenges in producing and disseminating grid based statistics: • Moreprecisedownscalingalgorithm • Automaticdataaquisition and integration • Visualization
THANK YOU VERY MUCH! Mrs Diana Makarenko-Piirsalu MSc in Landscape Ecology and Environmental Protection Geolytics OÜ Mere tee 15, Saviranna, Jõelähtme vald, Harjumaa, ESTONIA diana.m.piirsalu@gmx.ch Mob. +372 556 19 636 ESTP course on Geographic Information Systems (GIS): Use of GIS for making statistics in a production environment Statistics Norway, Oslo, 26th to 30th of March 2012