Download
1 / 18
180 likes | 183 Views
Creating a Culture of Accountability in Washington State Government GMAP- How it Works. Presented to the Legislative Program Review and Investigations Committee “Models of State Planning Efforts” November 8, 2007 Larisa Benson, Director

E N D
Creating a Culture of Accountability in Washington State GovernmentGMAP- How it Works Presented to the Legislative Program Review and Investigations Committee “Models of State Planning Efforts” November 8, 2007 Larisa Benson, Director Government Management Accountability & Performance (GMAP) Office of Governor Chris Gregoire
What is GMAP? GMAP is a disciplined method of performance review that leaders can use to make decisions and achieve results. • Governor and her senior staff personally and regularly review performance reports with agency directors. • Agencies are accountable for results. • Timely, accurate data informs the decisions. • Meetings are active, real-time problem solving sessions. • Action plans define who will do what by when. • Participants are expected to follow-up and report back.
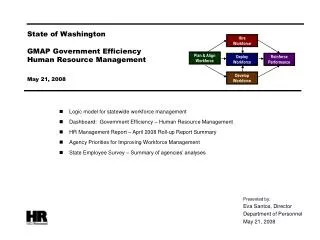
Where GMAP fits: Washington’s Management Framework GMAP = Analyze – Respond – Improve Communicate Results& ListenCommunications,including web & outreach Plain Talk Customer Survey &constituent groups • Plan • Strategic Plan guidelines • Logic model • Baldrige assessment tool • Customer & constituent feedback • Workforce Planning • Manage • Logic Model • Performance Development Plans • Work plans • Job Descriptions • Performance Confirmation • Respond • GMAP Sessions • Executive Management Meetings • Advisory Boards • Allocate Resources • Budget Instructions • Budget Development System • Agency allotment process • POG team guidance • Analyze • Management information systems • Performance Measure Tracking • HR, IT & Finance Reports • Customer & employee feedback • GMAP Report Templates • Improve • Process Improvement • (Lean, Six Sigma, etc.) • Business Portal & Permit Streamlining • Plain Talk • Performance Audits • Program Evaluation
Why do we ‘GMAP’? • Change the culture of state government • If leaders do it, it must be important • Focus on results that are important to our citizens • Balance policyand enterprise management objectives • Integrate multiple performance & accountability efforts • Focus on results rather than agency silos
Health Care Vulnerable Children Economic Vitality Government Efficiency Public Safety Transportation Welfare to Work Puget Sound Clean-Up Education (coming soon) What do we review in GMAP?
How does it work? • Where do measures come from? • What does a report look like? • What happens during the meeting? • What are the results?
Where do measures come from?Washington’s Citizen Engagement Process Citizen workshops Community leader roundtables Town Hall meetings
Where do measures come from? WashingtonDepartment of Social and Health ServicesGoal: Ensuring vulnerable children are safe Ultimate Outcome Children are safe. % of children not re-abused within 6 months …so that… Effective safety plans are created and followed… case file reviews Ultimate Policy Intent …so that… Intermediate Outcome We complete timely and accurate investigation reports… % reports filed on- time and complete …so that… Degree of Influence/Control Immediate Outcome We respond to child abuse calls… % responded to within 24 hours Source: Washington State Department of Social and Health Services, Children’s Administration Activity / Output
Where do measures come from? WashingtonDepartment of CorrectionsGoal: Reducing recidivism Communities are safer. % of inmates who commit crimes after release …so that… Inmates choose gainful employment over crime… % of inmates finding a job after release Ultimate Policy Intent Ultimate Outcome …so that… Inmates will have a marketable skill when they leave prison… # of inmates certified in the skill Intermediate Outcome …so that… Degree of Influence/Control Activity: We train inmates in work skills # of classes taught Immediate Outcome Activity / Output
Example for illustrative purposes What does a report look like?Executive Summary GMAP Report: Children’s Administration
What does a report look like?How will expanded re-entry programs impact an offender’s criminal behavior? BEFORE AFTER • Analysis: • Current out-of-state rental beds are approaching 1,000 • Projected shortfall of over 4,000 beds expected in FY 2017, driving the need for future prisons. • With the DOCs limited re-entry programs the Department will lose ground in impacting an offender’s criminal behavior as populations increase. • The Department contributes to reducing recidivism by increased participation in evidenced-based programming for offenders while they are under our jurisdiction. Source: Population estimates based on the June 2006 adopted Inmate Forecast provided by the Caseload Forecast Council. Reduction of prisons forecast, and increase of bed capacity based on the Departments budget request submitted on September 2006.
What does a report look like?How will we increase re-entry program participation in prisons? Source: Effects on crime outcomes and the benefits based on the 2006 October Published Report #06-10-1201 by the Washington State Institute for Public Policy. # of offenders released based on FY 2006 releases, as identified in the Department’s Offender Based Tracking System (OBTS).
What happens during the meeting? GMAP in ActionGovernor’s directive to respond to reports of child abuse within 24 hours.
What are the results? Preventing child abuse example Are we responding to calls within 24 hours? • Within a year, we were able to improve our timely responses to calls about child abuse from 69% to 93% in all six regions across the state. Does getting there faster mean children are safer? • Follow-up analysis shows a statistically significant drop (from 13% to 9%) in the rate of re-abuse that is correlated to the faster response time. • In plain talk, that means over 200 children are safer and will not suffer a recurrence of abuse.
What are the results? Additional results • Error rates on tax returns and food stamp benefits are among the lowest in the country, and the state is a national leader in providing key services online; • 93% of highway projects completed on-time, 95% completed within budget. • Fewer workplace injuries and claims helped enable the state to declare a six-month “rate holiday” this year on payments by employers and workers into the workers’ compensation medical fund; and • Service improvements reduced the “on-hold” waiting time by more than 60 percent since 2006 for callers to two state Medicaid telephone hotlines. • Doubled job placement rates at the Employment Security Department offices in Pierce County. • Reduced unanticipated employee leave by nearly half at the state Health Care Authority. • Clearing accidents faster on major corridors thanks to WSP, WSDOT and county coroners. • Reduced or redeployed over 1,100 middle managers (exceeded target of 1,000 by 10%) • Prisoners are evaluated prior to release 90% of the time, up from 70% in July 2005.
Lessons Learned • Top leaders must be personally engaged in active problem solving • You need a clear link between what we actually do and the outcomes we desire • Data must be timely & accurate with in-depth analysis • Results • Commit to action: who, what, when • Persistent follow-up • GMAP can inform legislative decisions
Challenges • Building trust with agencies – we’re about restoring dignity to public service, not “gotcha” • Telling the truth to power – even when it’s ugly • What happens when you don’t hit your goal? Fear of failure leads to paralysis • Everyone’s got a silver bullet – and agencies have to dodge them all • Making sense out of data overload – simplifying without dumbing it down • Our business intelligence technology is from the dinosaur age • Built to last – deep roots and tools that are truly useful to outlive “flavor of the month” • Numbers alone can’t tell the story – but they are the threshold into the tough conversations
For more information: www.gmap.wa.gov Larisa Benson, Director of GMAP 360-902-0481 gmap@gov.wa.gov