Download
1 / 47
470 likes | 574 Views
Taking the Science of Climate Change to Exascale. Don Wuebbles Department of Atmospheric Sciences University of Illinois Urbana, IL. INRIA, Grenoble June 2011. The Science is Clear: Climate change is one of the most important issues facing humanity.

E N D
Taking the Science of Climate Change to Exascale Don Wuebbles Department of Atmospheric Sciences University of Illinois Urbana, IL INRIA, Grenoble June 2011
The Science is Clear: Climate change is one of the most important issues facing humanity The scientific evidence clearly indicates that our climate is changing, and that human activities have been identified as the primary cause. All major science organizations agree with this statement.
One of Many Examples May 2009 National Academies of Sciences from the G8 + 5 other countries “The need for urgent action to address climate change is now indisputable.” United States, France, Germany, Italy, Japan, UK, Canada, Russia, plus Brazil, China, India, Mexico, South Africa
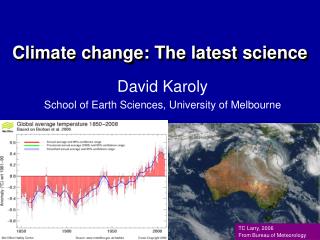
Three independent analyses of temperature record – Trends in close agreement
Conditions today appear to be unusual in the context of the last 2,000 years … Mann et al., 2008 PNAS
Observed Indicators of a Globally Changing Climate • Temperature rise • Sea-level rise • Increase in heavy downpours • Rapidly retreating glaciers • Thawing permafrost • Lengthening growing season • Lengthening ice-free season in the ocean and on lakesand rivers • Earlier snowmelt • Changes in river flows • Plants blooming earlier (1-3 days per decade earlier) • Animals, birds and fish moving northward
Human Factors in Climate Natural Drivers of Climate Variations in the Earth's orbit (Milankovic effect) Changes in atmospheric gases Variations in the energy received from the sun Changes in particles from burning fossil fuels and biomass Stratospheric aerosols from energetic volcanic eruptions
Climate models: Natural processes do not account for observed 20th century warming after 1965 Models with natural effects (volcanoes and solar) only Models with human and natural effects
Blue is the model predictions without anthropogenic forcing Pink is the model prediction with anthropogenic forcing Black are the observations
The Community Earth System Model • www.cesm.ucar.edu • Modeling the Earth System • A comprehensive hierarchy of models to: • Explore Earth climate history and processes responsible for variability and change • Estimate future of environment for policy formulation • Treats all known processes in the Earth’s climate system • Atmosphere • Oceans • Cryosphere • Land • Biosphere • Water cycle • Developed by NCAR, Universities and National Laboratories
Numerical models of the atmosphere Numerical models of the atmosphere are based on the physical laws of fluids. Basic framework = Spatial grid on which the equations of physics are representedRed lines = lat/lon grid Grid cell = smallest scale that can be resolved but many important process occurs on sub-grid scales Courtesy: Peter Lauritzen
Atmospheric Model Grids Problem near the poles where longitudes converge HOMME Regional focus MPAS SPHERICAL CENTROIDAL VORONOI GRID (Hexagon)
Vertical Model Grid Model top:CAM = 2 mbar - 40 km WACCM = 10-6 mb- 100 km 2.9 mbar • Vertical resolution is also important for quality of simulations • Levels are not equally spaced (levels are closer near surface and near tropopause where rapid changes occurs) • In CAM: “hybrid” coordinate - bottom: sigma coordinate (follows topography) - top: pressure coordinate - middle: hybrid sigma-pressure Pure pressure region 83 mbar Hybrid sigma-pressure region ~ 985 mbar Pure sigma region Surface ~ 1000 mbar
The Hydrostatic Primitive Equations • Simplified form of the equations of motion: the primitive equations Momentum conservation: Energy conservation: Mass conservation: Hydrostatic balance: Water vapor conservation Source and sinks due to phenomena occurring on scales smaller than grid resolution Parameterized processes or “the physics”
The hydrostatic primitive equations • Simplified form of the equations of motion: the primitive equations • Atmosphere is assumed to be in hydrostatic balance (good for horizontal grid > 10 km)compression due to gravity is balanced by a pressure gradient force (involves ignoring acceleration in the vertical component of the momentum equations) • Earth is assumed to be spherical and some other small terms in the momentum equations are neglected (atmosphere is thin compared to its horizontal extent)
Scales of Atmospheric Processes Important phenomena occurs at all scales. Interactions between phenomena at different scales => very challenging
Physical parameterizations • Process of including the effect of unresolved phenomena • Usually based on: • Basic physics (law thermodynamics) • Empirical formulation from observations • Key parameterizations in atmospheric model: • clouds • radiation • effects of unresolved turbulence and gravity waves • effects of convection on heat, moisture and momentum budgets. • Behavior of model is critically dependent of these parameterization processes
Sub-Grid Processes: Clouds • Need to represent: • Cloud formation and dissipation • Different types of clouds • Overlap of clouds • Convection in clouds • Precipitation Courtesy: Andrew Gettelman
The Community Atmospheric Model (CAM) = New parameterization
Anthropogenic Aerosol Effects Previous Generation Model Present Generation (CESM) New cloud microphysics and aerosol treatment permit the study of Aerosol Indirect Effects
Sea-Surface Temperature: reduced errors • Sea Surface Temperature (SSTs) errors compared to Hurrell dataset We use: Error = Model – Dataset • Root Mean Square Errors (RMSE) reduced in CAM5.1 Mean = 0.18RMSE = 1.07 Mean = -0.10RMSE = 0.94 CESM with CAM5.1 CESM with CAM4
20th Century Surface Temperature Change OBSERVATIONS NO INDIRECT AEROSOL Warming too strong
20th Century Surface Temperature Change OBSERVATIONS NO INDIRECT AEROSOL WITH INDIRECT AEROSOL More realistic regional temperature changes
Impact of aerosol changes • Changes over the 20th century in CESM-CAM5 • Increased aerosol burdens in SE Asia, Europe, NE America • Aerosol have a cooling effect on climate • Significant regional modulation of the general global warming trend Total aerosol change (OD) Surface temperature changes CAM5 is able to address many science questions related to the impact of anthropogenic emissions on climate that were not previously possible.
North American Annual Surface T (°C) Business-as-usual 2 X CO2 CO2 close to today
North American Annual Surface T (°C) Business-as-usual: CO2 more than doubled Aggressive mitigation: CO2 close to today
Surface Temperature Change: 21st Century RCP 2.6 RCP 4.5 RCP 8.5 2016 - 2035 2081-2100
Extremes: Number of Warm Days End of 20th Century End of 21st Century > 80ºF > 90ºF > 100ºF
CESM1: Seamless End-to-End Cycle of Model Development, Integration and Prediction with One Unified Model Code Base
The Complexity of a Climate Model • More components and new physics • 5 geophysical component models on different grids that exchange boundary dataonly via communication with a coupler • New physics => larger number of fields exchanged more frequently between components • Larger code base • ≈1.2 M lines of code (≈330K for CCSM3) • Fortran 90 (mostly), developed over 20+ years • 200-300K lines are critically important • Increased critical collaborations • DOE/SciDAC, University Community, CISL, NSF (PetaApps), ESMF> • 830 downloads of CESM1
Model Resolution Complexity • Ocean and Sea-Ice must run on same grid • displaced pole, tripole • Atmosphere and Land can now run on different grids • lat/lon, cubed sphere, new icosahedral • Globally grids span low resolution (3 degree) to ultra-high (0.125 ATM and 0.1 OCN/ICE) • Past grids were global and logically rectangular – now have regional, cubed sphere, icosahedral - moving to regionally refined • Regridding issues are becoming a very high priority
processors Original Multiple Executable CCSM3 architecture (cpl6) time CAM CLM CICE POP CPL New CPL7 Architecture New Single Executable CESM1 architecture (cpl7) Sequential Layout Hybrid Sequential/Concurrent Layouts Driver (controls time evolution) Driver CPL (regridding, merging) CAM POP CAM time CLM CPL CICE CLM CICE POP processors processors
Advantages of CPL7 New flexible coupling strategy • CPL7 built as a single executable with a single high-level driver. • CPL7 consists of a driver that controls the top level sequencing, the processor decomposition, and communication to components through subroutine calls while coupler operations such as mapping and merging are running under the driver on a subset of processors. • The driver runs on all processors and handles coupler sequencing, model concurrency, and communication of data between components. • Supports a large set of architectures. • CPL7 targets massively parallel petascalehardware, smaller linux clusters, and even single processor laptops. • Supports varying levels of parallelism via simple run-time configuration for processor layout.
1664 cores CAM CAM POP POP CPL7 CPL7 Reduced Idle time Load Balancing Optimize throughtput and decrease idle cycles 2.23 SYPD 4028 cores 1664 cores 3136 cores 1.53 SYPD CLM CLM CICE CICE Time Time Processors Processors Increase core count for POP Idle time/cores SYPD = Simulated Years per Day Courtesy of John Dennis
Future Directions: New Capabilities and Higher Resolution
Preparing CESM for PetascaleComputing • Significant computing resources are being directed toward high resolution, climate-length runs (e.g., 25-km atmosphere and 0.1° ocean simulations for several decades) • Higher resolution and regional mesh refinement in CESM1.0 (cubed sphere based dynamical core -- HOMME) • Experiments with new NESL (MPAS) dynamical core underway
Dynamical cores in CAM CAM3 (2004) Eulerian dynamical core Latitude/longitude grid CAM4 and CAM5 (2010) Finite volume dynamical core Latitude/longitude grid CAM5.2 (late 2011) Spectral element dynamical core HOMME (High-Order Method Modeling Environment) Designed for fully unstructured grids (currently based on cubed sphere grid)
Precipitable water in CAM4 (1/8 degree) At this resolution, hurricanes and typhoons become visible Columns=3x10⁶ Simulation:67,000 cores Courtesy: Mark Taylor
Resolution: Important to Model Accuracy CCSM3.5 (last 20 years of 20th century) Observed
Ultra-High Resolution Introduces new Requirements: • CPL7 infrastructure … and … • Memory scalability of all components • Minimize global arrays • Performance scalability of all components • Capability to use both MPI and OpenMP effectively to address requirements of new multi-core architectures • ALL active components, CAM, CLM, CICE and POP2, meet this requirement • Parallel I/O throughout system
PIO in CESM1 • Implemented in ALL component models • New asynchronous capability currently being added • Usage is critical for high resolution, high processor count simulations • Pure old-style serial I/O is one of the largest sources of global memory in CCSM - will eventually always run out of memory • New serial NetCDF I/O with PIO eliminates memory bottleneck
CCSM/HOMME Scalability 0.125°atm / 0.25° land /0.1°docn • CCSM times include ALL CCSM components (PIO use was critical) • Scalability of the dynamical core is preserved by CAM and scalability of CAM is preserved by CCSM • Scale out to over 128K cores get 5 SYPD (Jaguarpf) Work of Mark Taylor, Jim Edwards and Brian Eaton
The Model for Prediction Across Scales • We are well advanced on developing the next-generation Model for Prediction Across Scales (MPAS) • Based on unstructured centroidal Voronoi (hexagonal) meshes using C-grid staggering and selective grid refinement • To be utilized for weather, regional and global climate applications. • Currently being tested in the ocean model • Will allow for non-hydrostatic (< 10 km horizontal resolution) • Likely the eventual choice for exascale computing
Thank You www.cesm.ucar.edu Courtesy: Mark Taylor
Pacific Variability: ENSO and PDO PDO PDO CESM1 (CAM5) Observations Neale et al. (2008); Deser et al. (2011); Gent et al. (2011) NESL_NSF Review 09-12 May 2011