Download
1 / 30
430 likes | 812 Views
What Can You Do With qPCR?. Applications and Uses. (adapted from Roche RealTime PCR Application Manual). What is qPCR?.

E N D
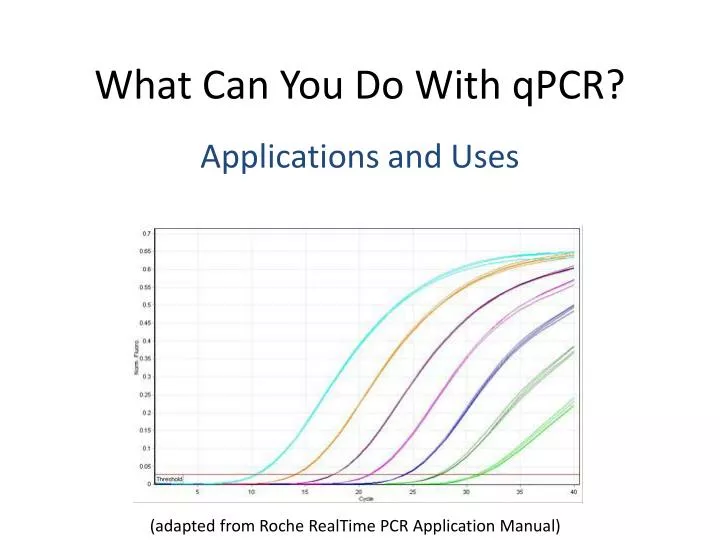
What Can You Do With qPCR? Applications and Uses (adapted from Roche RealTime PCR Application Manual)
What is qPCR? Real-time PCR - also known as quantitative PCR (qPCR)- measures PCR amplification as it occurs, so that it is possible to determine the starting concentration of nucleic acid. Every real-time PCR contains a fluorescent reporter molecule—a TaqMan® probe or SYBR® Green dye, for example—to monitor the accumulation of PCR product. As the quantity of target amplicon increases, so does the amount of fluorescence emitted from the fluorophore.
Advantages of real-time PCR include: • Generation of accurate quantitative data • Increased dynamic range of detection • Elimination of post-PCR processing • Detection down to one copy • Increased precision to detect smaller fold changes • Increased throughput
There are three phases in a basic PCR run: • Exponential • Linear (High Variability) • Plateau (End-Point: Gel detection for traditional methods) linear
What Can I Do with qPCR? • Gene Detection • Qualitative Analysis • Quantification • Absolute Quantification • Relative Quantification • Genetic Variation Analysis • SNP allele detection • Endpoint Genotyping • Melting Curve Genotyping
Gene Detection Qualitative Analysis • Provides ‘presence/absence’ data • Does not quantify the amount of DNA • Standards are not required • Positive and negative controls should be included
Quantification • Absolute quantification allows you to quantify a single target sequence and express the final result as an absolute value. • Relative quantification compares the levels of two different target sequences in a single sample.
Quantification of Target Sequences e.g., Virology Microbiology Determination of Gene Expression and Gene Dosage e.g., Oncology Analysis Purpose Application Field
Absolute Quantification with External Standards Cp Plot Cp vs. Concentration
Relative Quantification Relative quantification compares the levels of two different target sequences in a single sample (e.g., target gene of interest and a reference gene) and expresses the final result as a ratio of these gene levels. Concept of Relative Quantification concentration of target concentration of reference relative ratio =
Reference Genes • Reference genes (aka ‘housekeeping genes’) are stably expressed and should not be affected by the different experimental conditions. • Examples are ß-actin, GAPDH, rRNA • If no single reference gene is suitable for all conditions, consider using more than one housekeeping gene and averaging their assay levels to form a single reference value.
Reference Gene Normalization • Normalization to a reference gene corrects for qualitative and quantitative differences in the sample, such as those caused by: • Variations in initial sample amount or nucleic acid recovery • Possible RNA degradation in sample material • Differences in sample and/or nucleic acid quality • Variations in cDNA synthesis efficiency • Variations in sample loading or pipetting errors • PCR inhibitors and other factors influencing PCR
Optimization of Reaction Conditions Specificity, sensitivity, efficiency, and reproducibility are the important criteria to consider when optimizing a quantitative assay. Should be little orno test-to-test variations in Cpand fluorescent signal intensity.
Analysis options for the Basic and Advanced Analysis methods
Genetic Variation Analysis Single-nucleotide polymorphisms (SNPs) account for more than 90% of all genome sequence differences between individuals. In all genetic variation studies, a large number of individuals must be genotyped, in order to characterize a large number of markers. Alleles of known SNPs must be identified and called correctly, and the presence of newly arising variants must be detected.
Genetic Variation Analysis Different genotyping methods analyze fluorescent signals from different parts of a Real-Time PCR run.
Genetic Variation Analysis SNP analysis methods for the detection of known or unknown variants
Detecting Known Variants FAM dye detects samples that are homozygous for allele X. VIC/HEX dye detects samples that are homozygous for allele Y. Endpoint genotyping is based on a dual color approach.
The Endpoint Genotyping module in the LightCycler® 480 software groups samples with similar intensity distributions together and identifies each group as a genotype.
Advanced Method: Melting Curve Genotyping SNP variation is detected by binding sequence-specific anchor and and sensor probes next to each other and a signal is generated by FRET. A single base change will lead to an earlier melting temperature of the probe-target complex. The melting temperatures (Tms) will be different for amplicons with sequence differences (SNP alleles).
Advanced Method: Melting Curve Genotyping The Melting Curve Genotyping module in the LightCycler® 480 Software groups samples with similar melting profiles together and identifies each group as a genotype. Melt Curve genotyping allows analysis of several variable sites in combination (e.g. haplotypes). It requires careful design to make sure that the probe sequence covers at least one SNP, and optimization of each assay.
Detecting Unknown Variants--Gene Scanning by High Resolution Melting - HRM HRM analysis with non-specific, saturating DNA dyes allows differentiation of homo- and heterozygotes.
Gene Scanning by High Resolution Melting - HRM Difference Plot
Four major types of analysis are available • Summary – available for both Absolute and Relative Quantification. • Trend – displays data trends for different research samples and/or targets, e.g., changes in RNA expression that depend on incubation with an active compound. • Genotyping – used to display the genotypes of research samples in different analyses and to calculatethe allele frequency of variants. • Haplotyping- used to display and count the distribution patterns for variations on the same chromosome.
Detection Formats SYBR Green Saturating dyes for HRM, e.g. ResoLight
Detection Formats Hybridization Probes, e.g. HybProbe Hydrolysis Probes, e.g. TaqMan probe
Detection Formats Universal Probe Library These short LNA-modified probes detect a specific PCR amplicon, but also bind to more than one site in the transcriptome. However, their combination with suitable target-specific primers results in a target- specific assay. SimpleProbe Probes