Download

1 / 44
440 likes | 584 Views
The Great Blue Bead Company. l. l. l. l. l. l. Quality Is Our Priority. l. Based on a term project by Elizabeth A. Hoffman. The Great Blue Bead Company. Forman: Mr. John Mainieri 6 willing workers A recorder 2 inspectors 1 chief inspector. Quality Is Our Priority.

E N D
The Great Blue Bead Company l l l l l l Quality Is Our Priority l Based on a term project by Elizabeth A. Hoffman
The Great Blue Bead Company • Forman: Mr. John Mainieri • 6 willing workers • A recorder • 2 inspectors • 1 chief inspector Quality Is Our Priority
The Great Blue Bead CompanyProduction Process • Grasp the paddle and mix the raw materials. • Insert the paddle into the bead mixture. • Raise the paddle at a 20 degree angle so that as many depressions as possible will hold a bead. Gently angel to one side so excess production beads fall off. We want to produce 21 beads per shift (worker). • Inspectors count the beads independently and record the counts. Count both defectives and total beads produced.
The Great Blue Bead Company • The chief inspector checks the counts and announces the results, which are written down by the recorder. • The chief inspector dismisses the worker. • When all six willing workers have produced the days quota, the foreman evaluates the results.
ZERO DEFECTS ZERO DEFECTS ZERO DEFECTS ZERO DEFECTS ZERO DEFECTS
Red Bead Experiment Simulated Results
UCL = .47 Mean =.21 LCL = 0.00 DAY 4 DAY 1 DAY 2 DAY 3
Red Bead Experiment- Lessons for Managers • Variation exists in systems and, if stable, can be predicted. • Although the exact number of red beads in any particular paddle is not predictable, we can describe statistically what we expect from the system. Adapted from the Management and Control of QUALITY, 4th ed. by Evans and Lindsay, South-Western
Red Bead Experiment- Lessons for Managers • All the variation in the production of red beads, and the variation from day to day of any willing worker, came entirely from the process itself. • Neither motivation nor threats had any influence. • Many managers believe that all variation is controllable and place blame on those who cannot do anything about it. Adapted from the Management and Control of QUALITY, 4th ed. by Evans and Lindsay, South-Western
Red Bead Experiment- Lessons for Managers • Numerical goals are often meaningless. • Merit pay and probation actually reward or penalize the system and lead to worker frustration. • There is no basis for assuming that the best willing workers of the past will be the best in the future. Adapted from the Management and Control of QUALITY, 4th ed. by Evans and Lindsay, South-Western
Red Bead Experiment- Lessons for Managers • Management is responsible for the system. The experiment shows bad management. • Procedures are rigid. • Willing workers have no say in improving the process. • Management is responsible for the incoming material, but did not work with the supplier to improve the inputs to the system. Adapted from the Management and Control of QUALITY, 4th ed. by Evans and Lindsay, South-Western
Red Bead Experiment- Lessons for Managers • Management designed the system and decided to rely on inspection to control the process. Three inspectors are probably as costly as the six workers and add practically no value to the input. Adapted from the Management and Control of QUALITY, 4th ed. by Evans and Lindsay, South-Western
Chapter 12Statistical Applications in Quality and Productivity Management Chapter Objectives • Introduction to the History of Quality • Deming’s 14 Points of Management • Common Cause Variation and Special Cause Variation • Control Charts for the Proportion of Nonconforming Items • Control Charts for the Range and Mean
Chapter 12Statistical Quality Management Chapter Homework • Read sections 12.1 through 12.4 and 12.6 (skip 12.5) • Do quick results 12.4e and 12.6e • Do problems 12.5 and 12.17 – use excel for the charts, but double check the control limits by hand
Quality Management • Focus on process improvement • System, not individual • Teamwork • Customer satisfaction • Organizational transformation • No fear • Requires investment, saves money
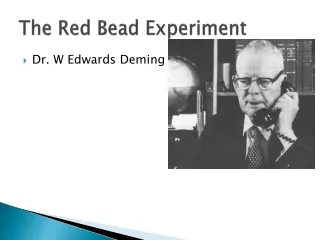
Dr. W. Edwards Deming • B.S. in Electrical Engineering University of Wyoming, 1921 • M.S. Mathematics and Mathematical Physics University of Colorado, 1925 • Ph.D. from Yale University, 1928 http://www.deming.org/
Control Charts • Sequential collection of variable data • Control Chart to monitor variation • Focus on time • Study nature of variability • Causes of Variation • Special or Assignable • Chance or Common
Control Limits • Used to evaluate variation for: • Variation outside established control limits • Patterns over time • Process Average + 3 standard deviations • Upper Control Limit (UCL) = process average + 3 standard deviations • Lower Control Limit (LCL) = process average – 3 standard deviations
Control Chart Patterns Special or Assignable Cause Variation This is a “signal.” Outside Control Limit
Control Chart Patterns Pattern over Time Increasing Trend The magic number is 8!
Control Chart Patterns Common Cause Variation “Static” vs. a “Signal” Within Control Limits
The p Chart • Attribute Control Chart • For Proportion of Non-Conforming Items • Control Limits
The p Chart Obtaining Upper and Lower Control Limits
SummaryThe p Chart • Control Chart for the Proportion • Used to determine whether special or common • Control Limits:
Control Charts for theRange and Mean • Used when characteristic is measured numerically – called Variables Control Charts • More sensitive than p chart • Two charts • Variation in a process (range) • Process Average (mean) • Interpret variation chart first (range)
The R Chart • Must be examined first • Out of control variation could cause misinterpretation of the mean chart From table E.9, page E-18 d3 represents the relationship between the standard deviation and the standard error d2 represents the relationship between the standard deviation and range Control Limits for the Range
Subgroups of size n The Chart • If the Range is in Control • Measures the variability of the mean Control Limits for the Mean Chart OR
Example 12.15 Page 756-757 Control Limits for the Range
Example 12.15 cont. The R Chart
Use These Equations Example 12.15 cont. Control Limits for the Mean
Example 12.15 cont. The Mean Chart
SummaryControl Charts for the Rangeand Mean • Two charts • Variation in a process • Process Average • Interpret variation chart first (range) • Control Limits for the Range:
SummaryControl Charts for the Rangeand Mean • Interpret mean chart second • Control Limits for the Range: Subgroups of size n
OR OR