Download
1 / 10
100 likes | 215 Views
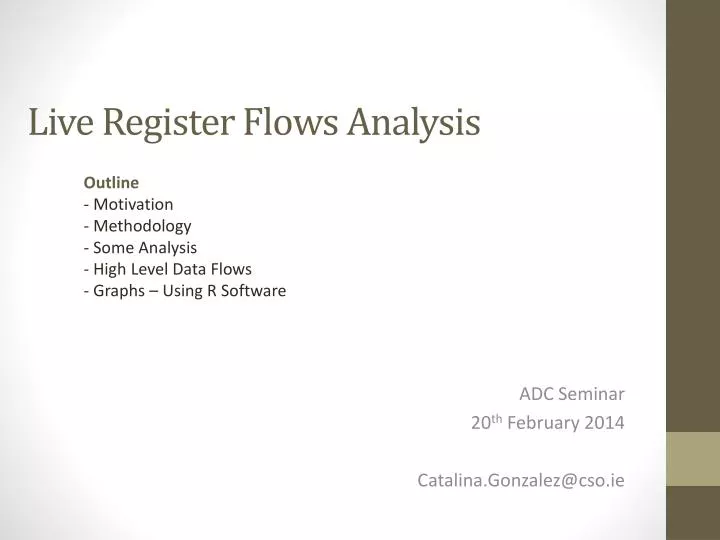
Live Register Flows Analysis. Outline - Motivation - Methodology - Some Analysis - High Level Data Flows - Graphs – Using R Software. ADC Seminar 20 th February 2014 Catalina.Gonzalez@cso.ie. Motivation. In depth analysis of unemployment in Ireland

E N D
Live Register Flows Analysis Outline - Motivation - Methodology - Some Analysis - High Level Data Flows - Graphs – Using R Software ADC Seminar 20th February 2014 Catalina.Gonzalez@cso.ie
Motivation In depth analysis of unemployment in Ireland Part of the Role of ADC - Promote and use data to inform decision making/ further develop the Irish Statistical System.
Simple Methodology • Identify those on the Live Register on the last Friday of the month (as per the Live Register methodology) • Compare with previous month • Stayers - Those that are present in both months • Joiners - Those that are present in current month but not in previous month • Leavers - Those that are present in previous month but not in current month • Focus on publishing detailed aggregates on Statbank(http://www.cso.ie/px )
Detailed Outputs Stayers, Leavers and Joiners by Welfare office • LRM30 – by sex and age group • LRM31 – by previous occupation held • LRM32 – by marital status • LRM33 – by dependents status • LRM34– by mortgage or rent indicator
Conclusions • Wealth of data available with respect to the Live Register • Easily accessible • Via Web Interface and other statistical Programs • County visualisation showcase with R • Could have used Local Welfare Office, Occupation, Sex, or other classification variable. • Other programing languages could have been used. Java Script library to read .px files Sas Macro also available to read .px file • R code will be made available (as is) in the seminar webpage