Download
1 / 1
10 likes | 89 Views
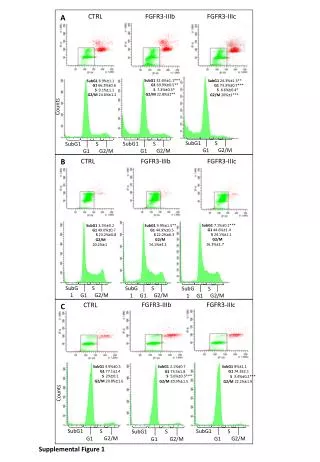
Explore quantified cell cycle phases in S, G1, and G2/M, with emphasis on boosting growth rates and distribution. Investigate FGFR3-IIIc and IIIb roles alongside control counts for advanced insights.

E N D
SubG1 9.9%±1.5** SubG1 7.1%±0.1*** SubG1 3.5%±0.2 SubG1 24.3%±1.5** SubG1 8%±1.1 SubG1 8.9%±1.1 SubG1 4.9%±0.5 SubG1 2.1%±0.7 SubG1 32.6%±1.1*** G1 66.3%±0.6 G1 73.3%±0.7*** G1 49.0%±0.7 G1 44.6%±1.4 G1 44.9%±0.5 G1 74.3±2.1 G1 77.1±1.4 G1 73.5±1.8 G1 69.9%±0.5** Counts S 23.2%±0.8 S 22.2%±0.3 S 6.6%±0.4* S 24.1%±1.1 S 9.1%±1.1 S 2%±0.1 S 3.4%±0.2*** S 5.6%±0.5*** S 7.3%±0.5* G2/M 24.6%±1.2 G2/M 16.3%±1.7 G2/M 20%±1*** G2/M 14.1%±4.2 G2/M 20.2%±1 G2/M 20.8%±1.6 G2/M 22.2%±1.9 G2/M 20.9%±1.5 G2/M 22.8%±1** SubG1 SubG1 SubG1 SubG1 SubG1 SubG1 SubG1 SubG1 SubG1 S S S S S S S S S G2/M G2/M G2/M G2/M G2/M G2/M G2/M G2/M G2/M G1 G1 G1 G1 G1 G1 G1 G1 G1 FGFR3-IIIc CTRL FGFR3-IIIb A FGFR3-IIIb FGFR3-IIIc CTRL Counts B CTRL FGFR3-IIIb FGFR3-IIIc C Supplemental Figure 1