Download
1 / 37
370 likes | 603 Views
Lo w -Level Analysis of Affymetrix Data. Mark Reimers National C an c er Ins t i t u t e Bethesda Maryland. Overview. the Affymetrix technology Normalization Relationships among probes in Combining Probe Information Quality Control. *. *. Hybridized Probe Cell. *.

E N D
Low-Level Analysis of Affymetrix Data Mark Reimers National Cancer Institute Bethesda Maryland
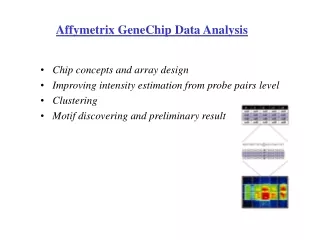
Overview • the Affymetrix technology • Normalization • Relationships among probes in • Combining Probe Information • Quality Control
* * Hybridized Probe Cell * GeneChipProbe Array * * Oligonucleotide probe 20µm Each probe cell or feature contains millions of copies of a specific oligonucleotide probe 1.28cm Over 400,000 different probes complementary to genetic information of interest Image of Hybridized Probe Array Affymetrix GeneChip® Probe Arrays Single stranded, fluorescently labeled DNA target
5´ 3´ Published Gene Sequence Multiple (11-20) 25-base oligonucleotide probes Perfect Match Mismatch Affymetrix Probe Design PM is exactly complementary to published sequence MM is changed on 13th base
Affymetrix Image Reading • About 100 pixels per probe cell • Selects 16-25 brightest contiguous pixels • Take average of selected pixels • Variability in best pixels ~ 5-20% Image courtesy of Affymetrix
Normalization Approaches • Simple: find average of each chip; divide all values by chip average • MAS5: fit regression line relative to a reference chip • Invariant set: find subset of probes in almost same rank order as in a reference chip • Quantile normalization: fit to average quantiles across experiment • Others: local loess, local regression.
Comparing Probes on Different Chips Plots of two Affymetrix chips against the experiment means
MAS 5.0 Normalization • Plot probes from each chip against common base-line chip • Fit regression line to middle 98% of probes This method fits the ends well, but seems to miss an important trend between 1500 and 4000
Invariant Set (Li-Wong) Method • Select baseline chip X • For each other chip Y: • Select probes p1, …, pK, (K ~ 10000), such that p1 < p2 < …< pK in both chips X and Y • Fit running median through points { (xp1,yp1), …, (xpK, ypK) } • Subtract fitted value along running meidan from each y value
Quantile Method (part of RMA) • Distributions of probe intensities vary substantially among replicate chips • This cannot be even approximately resolved by any linear transformation • Apply a non-linear transform, based on the idea that comparable quantiles of the probe distribution should have comparable values • This doesn’t wipe out individual gene differences, although it compresses variation at the high end
Quantile Normalization Distribution of Chip Intensities Reference Distribution Formula: xnorm = F2-1(F1(x)) Density function Assumes: gene distribution changes little F1(x) F2(x) Cumulative Distribution Function a x y
Quantile normalization works Quantile normalization .vs. normalization by scaling
Methods for computing expression • Affymetrix MicroArray Suite: v.4, 5 • robust average of probes on one chip • Linear Model (multi-chip) methods • dChip: Li and Wong • Bioconductor affy package (RMA) • Bolstad, Irizarry, Speed, et al • Many others published • Some based on thermodynamic considerations
Probe Variation • Probes vary by two orders of magnitude on each chip Signal from 16 probes for the GAPDH gene on one chip • Individual probes don’t agree on fold changes • across chips • Bright probes more often, but not always, more reliable
Probe Variation - II • Typical probes are two orders of magnitude different! • CG content is most important factor • RNA target folding also affects hybridization 3x10⁴ 0
Principles of MAS 5 method • First estimate background • bg = MM (if physically possible) • log(bg) = log(PM)-log(non-specific proportion) (if impossible) • Non-specific proportion = max(SB, e) • SB = Tukeybiweight(log(PM)-log(MM)) • Signal = Tukeybiweight(log(Adjusted PM))
Critique of MAS 5 principle • ‘Average’ of different probes isn’t really meaningful, since probes have intrinsically different hybridization characteristics • The MAS5 method doesn’t ‘learn’ based on cross-chip performance of individual probes
Motivation for multi-chip models: Raw data from a single probe set in a spike-in study; each color represents a different probe in the probe set; note the parallel trend across chips of all probes, although some probe signals depart from the pattern log(PM) log(concentration) Courtesy of Terry Speed
Linear Models • Extension of linear regression • Essential features: • Measurement errors independent of each other • ‘random noise’ • Needs normalization to eliminate systematic variation • Noise levels comparable at different levels of signal • Small number of factors combine in linear function or simple algebraic form to give predicted levels
Model for Probe Signal • Each probe signal is proportional to • i) the amount of target sample – qi • ii) the affinity of the specific probe sequence to the target – fj • NB: High affinity is not the same as specificity • Probe can give high signal to intended target and also to other transcripts Probes 1 2 3 chip 1 q1 q2 chip 2 f1f2f3
Multiplicative Model • Each gene has a set of probes p1,…,pk • Each probe pj binds the gene with efficiency (‘avidity’) fj • In each sample there is an amount qi of the target transcript • In principle, intensity of probe j on chip i – PMij – should be proportional to fj x qi • Always some noise; and some outliers!
Robust Statistics • Outlier: a measure that is far beyond the typical random variation • common in biological measures • 10-15% in Affy probe sets • Robust methods try to fit the majority of data points • Issue is to identify which points to down-weight or ignore • iteratively re-weighted least squares • Median polish
Li & Wong (dChip) • Model: PMij =qifj+ eij - Original model (dChip 1.0) used PMij -MMij =qifj+ eij by analogy with Affy MAS 4 • Outlier removal: • Identify extreme residuals • Remove • Re-fit • Iterate until converge Fitting probes in one set on one chip Dark blue: PM values Red: fitted values Light blue: probe SD
Critique of Li-Wong model • Model assumes that noise for all probes has same magnitude • All biological measurements exhibit intensity-dependent noise
Bolstad, Irizarry & Speed – (RMA) • For each probe set, take the log transform of PMij =qifj: • i.e. fit the model: • Fit this additive model by iteratively re-weighted least-squares or median polish Where nlog() stands for logarithm after normalization
Critque of RMA • Assumes probe noise is homoschedastic (comparable variances) on log scale • In fact noise for low signal probes appears to be much greater • Depends on normalization & bg compensation • Variance-stabilizing transform seems better in principle; so far not a great deal of improvement in practice
Comparing Expression Measures Compare gene abundance estimates based on identical samples (These were non spike-in genes in the spike-in experiment) Better performance means variation of estimates should be smaller The figure shows standard deviations of expression estimates across arrays arranged in four groups of genes by increasing mean expression level Courtesy of Terry Speed Green: MAS5.0; Black: Li-Wong; Blue, Red: RMA
Comparison Summary • Affymetrix Suite gets better every year • Affymetrix is developing their own multi-chip model • MAS P & A calls reasonable proxies for confidence (not gene abundance) • based on probe-by probe comparison of PM & MM • MAS 5.0 estimation does a reasonable job on abundant genes • dChip and RMA do better on genes that are less abundant • Signalling proteins, transcription factors, etc
Model-based QC for Affy Chips • Outliers from fitted model may show spatial pattern Portion of an Affy chip Pink pixels represent probes that do not fit consensus pattern of relative probe intensities These probes will be down-weighted or ignored by a robust multi-chip model. If non-conforming probes are numerous and wide-spread then suspect such a chip Image made with dChip
Current Work: Improving the Model • How to use the MM information profitably • Combine estimates from PM and MM probes? • Assessments of probe quality • Accurate estimates of probe background • Normalization method based on 2-d loess to correct spatial inhomogeneity
Relation Between PM and MM Across One Experiment Set MM PM Colored symbols are one probe
Probe Specific Background Fitted Data Probe BG subtracted Horizontal lines represent probes; colored symbols correspond to arrays After subtracting individual backgrounds for each probe, the ratios among corresponding arrays are more consistent between probes
Software for Affymetrix • MAS provided by Affymetrix • Current version 6 in beta testing • dChip from www.dchip.org • RMA from www.bioconductor.org • affy package • Regularly updated • Version with probe background in September from my website: reimers.cgb.ki.se