Download
1 / 26
260 likes | 427 Views
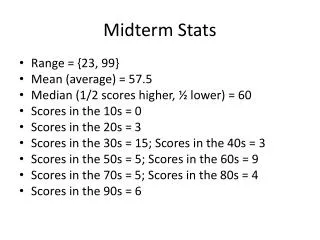
Assets and capabilities poverty in South Africa Sandile Simelane Statistics South Africa. Census. STATS SA. Education level of the labour force, 2011. Census. Outline. STATS SA. Background Research questions Data & methods Results Discussion, conclusions & policy implications.

E N D
Assets and capabilities poverty in South Africa SandileSimelane Statistics South Africa Census STATS SA Education level of the labour force, 2011
Census Outline STATS SA • Background • Research questions • Data & methods • Results • Discussion, conclusions & policy implications Education level of the labour force, 2011
Census Background STATS SA • This paper uses a composite index of household assets and capabilities data to examine levels and trends of poverty for provinces, district councils (DCs) and local municipalities of South Africa. • The resulting index: the assets and capabilities poverty (ACP) • Calculated at household level • demonstrates that poverty can be measured in the absence of income or expenditure data. • The index of ACP is a complement not replacement of income & expenditure measures of poverty Education level of the labour force, 2011
Census Background contd…. STATS SA Motivations for the approach • The paper conceptualizes poverty as a multidimensional phenomenon that can be proxied by the socioeconomic variables that are commonly collected in pop. censuses and household surveys. • South Africa’s current socio-economic policy (RDP) states that meeting basic needs for all in the country’s population is the top priority for government. • Income data are poorly measuredin LDCs (Bollen, Glanville and Stecklov 2001; World Bank 1995), including South Africa (Statistics South Africa 2000). • The index used has been found to be a good measure of wealth in other developing countries (Filmer and Pritchett 2001). Education level of the labour force, 2011
Census Research questions STATS SA • Who are assets and capabilities poor in South Africa and what has been the trend in poverty levels between 1996 and 2007? • How are the are the assets and capabilities poor (hholds/ individuals) distributed, spatially, in the country? • What are the defining characteristics of the poor? Education level of the labour force, 2011
Census Data & methods STATS SA Data Pooled dataset comprising the 2007 CS and the 1996 & 2001 censuses of South Africa Revisions to this work will include census 2011 Q. Why pooled data? A. To control for the cross-dataset differences in the distribution of the variables used & derive estimate that are comparable across the datasets. CS 2007 • Large sample survey • Representative at municipality level Education level of the labour force, 2011
Census Data & methods contd… STATS SA Methods Identification of Assets & Capabilities poor households Step 1: Computation of the index Index of ACP computed using Principal Components Analysis (PCA) by combining information on 8 categories of household assets/characteristics and 2 measures of household functional capabilities. Education level of the labour force, 2011
Census Data & methods contd… STATS SA About PCA • PCA is a statistical procedure that reduces the dimensionality of multiple variables by transforming them into few linear components that are uncorrelated. • For each component, PCA assigns to each observation (household) a scoring factor based on the household’s possession (or lack) of the variables included in the computation, after taking into account the covariation of these variables in the population being studied. • These scores can be used to sort the observations (households) from the poorest to the wealthiest. • The 1st component accounts for the largest proportion of the total variation in the set of variables used. For this reason, the 1st component is used as the index of ACP. Education level of the labour force, 2011
Census Data & methods contd… STATS SA Variables used in PCA Education level of the labour force, 2011 23 binary variables & 2 continuous variables
Census Data & methods contd… STATS SA Assessment of the index • The scoring factors are all in the expected direction. • All the variables associated with higher SES—e.g. having piped water inside the dwelling—have bigger (and +ve) scoring factors than those that are perceived to measure lower levels of SES Education level of the labour force, 2011
Census Data & methods contd… STATS SA Identification of Assets & Capabilities poor households Step 2: Calculation of the poverty line Poverty line = ½ median value of index of ACP. • based on theory of Justice as Fairness (Rawls 1971) Thus estimate of poverty level in a give geographic unit = Education level of the labour force, 2011
Census Data & methods contd… STATS SA Analysis of characteristics of poor households Logistic regression model is employed pTi = probability that household (i) is classified as poor in year T Explanatory variables include: sex of the head of household; rural/ urban residence; province; age of household head; tenure status of dwelling unit; type of residence; crowding; etc. NB: No causality implied Education level of the labour force, 2011
Census Data & methods contd… STATS SA Statistical analysis of spatial distribution of poor households • Moran’s I = global test for clustering/ autocorrelation • Operates like correlation coefficient Education level of the labour force, 2011
Census Data & methods contd… STATS SA Statistical analysis of spatial distribution of poor households • Local indicator of spatial association (LISA) statistics Interpretation of LISA • positive Ii means either a high value is surrounded by high values (high-high) or a low value is surrounded by low values (low-low). • A negative score of Ii means either a high value is surrounded by low values (high-low) or vice versa (low-high). Education level of the labour force, 2011
Census Results: levels & trend STATS SA Cumulative Distribution Functions (CDFs) of index of ACP, 1996-2007 Education level of the labour force, 2011 • Huge but declining, levels of inequality in living stds during the period 1996-2007 • Decline in national level of ACP driven by improvements among the poor
Census Results: levels & trend STATS SA Levels and trend in household assets and capabilities poverty by province, 1996-2007 Education level of the labour force, 2011 3rd3rd3rd
Census Results contd…spatial distribution of ACP STATS SA Map showing the proportion (%) of assets & capabilities poor households by local Municipality, South Africa 1996. Education level of the labour force, 2011
Census Results contd…spatial distribution of ACP STATS SA Education level of the labour force, 2011 Lisa Cluster map for ACP, 1996 Moran’s I = 0.4088, p<0.05
Census Results contd…spatial distribution of ACP STATS SA Education level of the labour force, 2011
Census Results contd…spatial distribution of ACP STATS SA Education level of the labour force, 2011 Lisa Cluster map for ACP, 2007 Moran’s I = 0.5090, p<0.05
Census Results contd…spatial distribution of ACP STATS SA Lisa Cluster map for ACP, 2007 Moran’s I = 0.5090, p<0.05 Education level of the labour force, 2011 Lisa Cluster map for ACP, 1996 Moran’s I = 0.4088, p<0.05 While there was general improvement in poverty levels nationally and in FS b/t 1996 & 2007 clustering of households according to poverty status worsened during the period.
Census Results contd… characteristics of assets & capabilities poor households STATS SA Odds ratios from logistic regression model of probability of hhold asset & capabilities poverty on selected variables, 2007 Education level of the labour force, 2011 Likelihood of ACP highest in MP, EC, LP compared to RC A hhold in FS was 3.2 times more likely to be poor than one in WC in 2007 RC= reference category
Census Results: characteristics of assets & capabilities poor households STATS SA Education level of the labour force, 2011 Other findings Assets & capabilities poverty highest in rural areas Household headed by females more likely to be ACP Households headed by Black Africans more likely to be poor than other groups
Census Discussion STATS SA Education level of the labour force, 2011 SA experienced huge but declining, levels of inequality in living stds during the period 1996-2007. Proportion of households that are assets & capabilities poor decreased nationally from 49.1% in 1996 to 38.2% in 2007. The same applies to Free State
Census Discussion….. contd STATS SA Education level of the labour force, 2011 Assets & capabilities poverty highest in rural areas Household headed by females more likely to be ACP Households headed by Black Africans more likely to be poor than other groups
Census Conclusion STATS SA Criticism of the index • The index is not a good indicator of performance of individual households because it is based on community variables. Reflection • It is true that most of the variables included in the index are community based but in a setting like in RSA where policy is clear that ALL households should enjoy the assets/variables it important to profile the hholds that lag behind…. Education level of the labour force, 2011